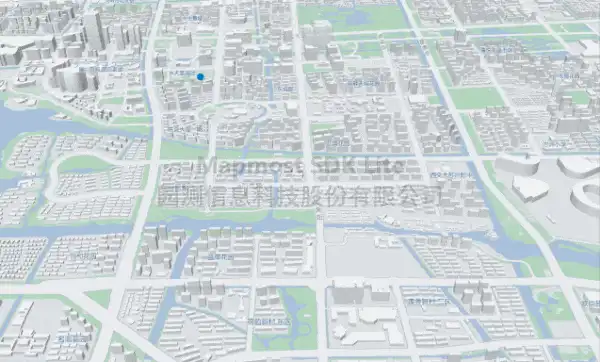
轨迹移动点位动画
地图显示轨迹移动点位动画。
   <!DOCTYPE html>
   <html>
   <head>
       <meta charset="utf-8"/>
       <title>轨迹移动点位动画</title>
       <meta name="viewport" content="initial-scale=1,maximum-scale=1,user-scalable=no"/>
       <style>
           body {
               margin: 0;
               padding: 0;
           }

           #map {
               position: absolute;
               top: 0;
               bottom: 0;
               width: 100%;
           }

       </style>
       <script src="https://delivery.mapmost.com/cdn/sdk/lite/v1.0.0/mapmost-lite-min.js"></script>
   </head>
   <body>
   <div id="map"></div>
   <script>

       var map = new mapmost.Map({
           container: 'map',
           style: "<your style url>",
           center: [120.72541613154851, 31.31171803927643],
           zoom: 14,
           userId: '***', // 授权码,此参数务必添加
       });

    let radius = 0.01;

        function pointOnCircle(angle) {
            return {
                "type": "Point",
                "coordinates": [
                    120.72541613154851 + Math.cos(angle) * radius,
                    31.31171803927643 + Math.sin(angle) * radius
                ]
            };
        }

        map.on('load', function () {
    // Add a source and layer displaying a point which will be animated in a circle.
            map.addSource('point', {
                "type": "geojson",
                "data": pointOnCircle(0)
            });

            map.addLayer({
                "id": "point",
                "source": "point",
                "type": "circle",
                "paint": {
                    "circle-radius": 10,
                    "circle-color": "#007cbf"
                }
            });

            function animateMarker(timestamp) {
                // Update the data to a new position based on the animation timestamp. The
                // divisor in the expression `timestamp / 1000` controls the animation speed.
                map.getSource('point').setData(pointOnCircle(timestamp / 1000));

                // Request the next frame of the animation.
                requestAnimationFrame(animateMarker);
            }

            // Start the animation.
            animateMarker(0);
        });


   </script>
   </body>
   </html>