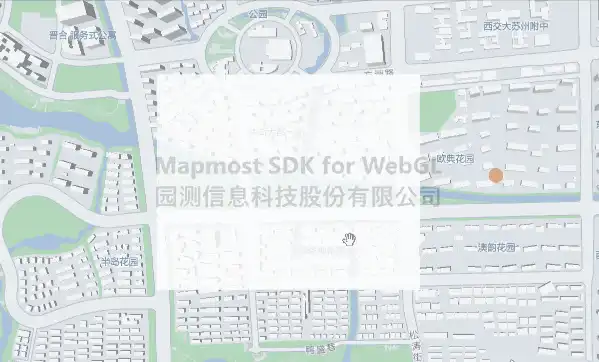
加载GeoJSON数据
加载GeoJson格式数据源,并构建可视化图层。

<!DOCTYPE html>
<html>
<head>
    <meta charset="utf-8"/>
    <title>addGeojsonLayer</title>
    <meta name="viewport" content="initial-scale=1,maximum-scale=1,user-scalable=no"/>
    <style>
        body {
            margin: 0;
            padding: 0;
        }

        #map {
            position: absolute;
            top: 0;
            bottom: 0;
            width: 100%;
        }
    </style>
    <script src="https://delivery.mapmost.com/cdn/sdk/webgl/v9.2.0/mapmost-webgl-min.js"></script>
</head>
<body>
<div id="map"></div>
<script>
    let map = new mapmost.Map({
        container: 'map',
        style: "<your style url>",
        center: [120.72541613154851, 31.31171803927643],
        zoom: 14,
        userId: '***', // 授权码
    });
    map.on('load', function () {
        map.addSource('national-park', {
            'type': 'geojson',
            'data': {
                'type': 'FeatureCollection',
                'features': [
                    {
                        'type': 'Feature',
                        'geometry': {
                            'type': 'Polygon',
                            'coordinates': [
                                [
                                    [120.720, 31.308],
                                    [120.730, 31.308],
                                    [120.730, 31.315],
                                    [120.720, 31.315],
                                    [120.720, 31.308],
                                ]
                            ]
                        }
                    },
                    {
                        'type': 'Feature',
                        'geometry': {
                            'type': 'Point',
                            'coordinates': [120.72541613154851, 31.31171803927643]
                        }
                    }
                ]
            }
        });

        map.addLayer({
            'id': 'park-boundary',
            'type': 'fill', // geojson 数据源支持circle/ line/ fill/ symbol/ fill-extrusion/ heatmap
            'source': 'national-park',
            'paint': {
                'fill-color': '#ffffff',
                'fill-opacity': 0.8
            },
            'filter': ['==', '$type', 'Polygon']
        });

        map.addLayer({
            'id': 'park-volcanoes',
            'type': 'circle',
            'source': 'national-park',
            'paint': {
                'circle-radius': 10,
                'circle-color': '#ffa46c'
            },
            'filter': ['==', '$type', 'Point']
        });
    });
</script>
</body>
</html>