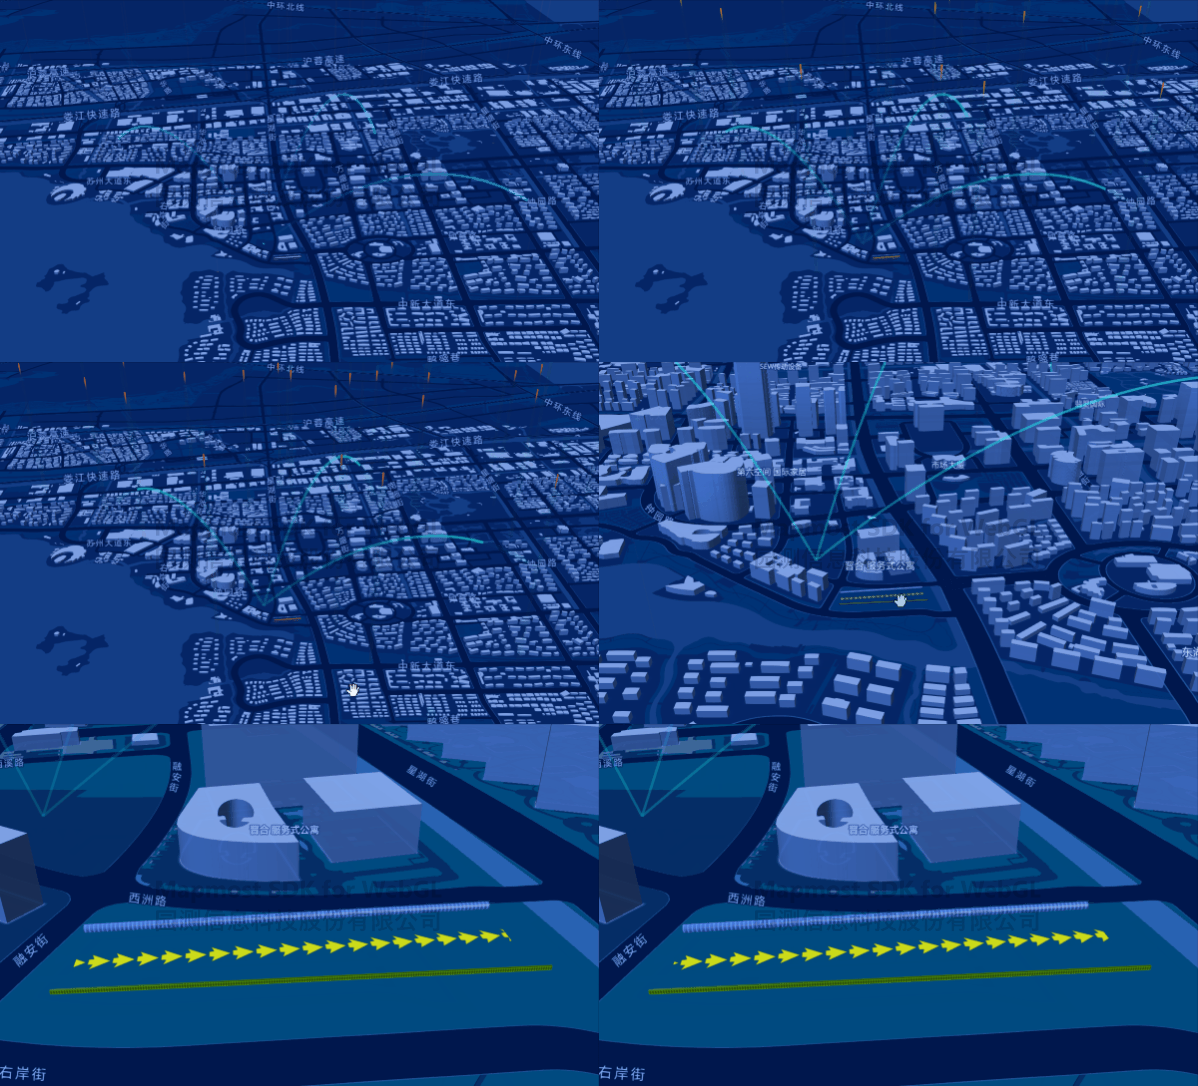
三维动态线
基于坐标点位构建三维动态线。

<!DOCTYPE html>
<html>

<head>
    <meta charset="utf-8"/>
    <title>构建三维动态线</title>
    <meta name="viewport" content="initial-scale=1,maximum-scale=1,user-scalable=no"/>
    <style>
        body {
            margin: 0;
            padding: 0;
        }

        #map {
            position: absolute;
            top: 0;
            bottom: 0;
            width: 100%;
        }

    </style>
    <script src="https://delivery.mapmost.com/cdn/sdk/webgl/v9.2.0/mapmost-webgl-min.js"></script>
    <script src="../../dist/js/Fun.js"></script>
    <script src="../example_data/flowLine_data.js"></script>
</head>

<body>
<div id="map"></div>
<script>
    let map = new mapmost.Map({
        container: 'map',
        style: "<your style url>",
        center: [120.71832572622088, 31.317901031136927],
        zoom: 15.7,
        pitch: 60,
        bearing: 0,
        userId: '***', // 授权码
        env3D:{
            envMap: "../example_data/hdr/WhiteBG_Ref_1K.hdr",
            exposure: 0.7,
        }
    });

    map.on('load', function () {

        let options = {
            id: 'model_id',
            type: 'model',
            project: "3857",
            center: [120.71755968678801, 31.32662823446909, 0],
            callback: function (group, layer) {

                let line_Circle = layer.addFlowLine({
                    type: "Circle",
                    repeatX: 100, // 沿着管道路径方向重复数,默认10
                    repeatY: 1, // 环绕管道方向重复数,默认为1
                    radius: 2, // 管道半径,默认为1
                    // closed:true,
                    speed: 2,
                    image: "../example_data/pic/wall.png",
                    opacity: 0.8,
                    side: "DoubleSide",
                    data: {
                        coordinate: [[120.71620510490567, 31.31511250302556, 2], [120.71826177206594, 31.315319923394995, 2.0]]
                    }
                });

                let line_Rectangle = layer.addFlowLine({
                    type: "Rectangle",
                    color: "#ffff00",
                    steps: 10,
                    rectangle: [2, 1],
                    repeatX: 20, // 沿着管道路径方向重复数,默认10
                    repeatY: 1, // 环绕管道方向重复数,默认为1
                    speed: 2,
                    image: "../example_data/pic/wall.png",
                    side: "DoubleSide",
                    data: {
                        coordinate: [[120.71621788554057, 31.31466673893327, 2.0], [120.71838916982404, 31.314822371221595, 2.0]]
                    }
                })

                // 生成贝塞尔曲线测试数据
                let data_trail1 = getBSRPoints(120.71541557869517, 31.316503949907542, 120.73787560336916, 31.321925190347713, 800);
                let data_trail2 = getBSRPoints(120.71541557869517, 31.316503949907542, 120.72619950480242, 31.33360076088249, 1500);
                let data_trail3 = getBSRPoints(120.71541557869517, 31.316503949907542, 120.69933418653403, 31.332725809914024, 900);
                [data_trail1, data_trail2, data_trail3].map(data => {
                    layer.addFlowLine({
                        type: "trail",
                        color: '#1ffff8',
                        speed: 4,
                        opacity: 0.6,
                        width: 5,
                        data: {
                            coordinate: data
                        }
                    });
                })

                flow_data.map(data => {
                    layer.addFlowLine({
                        type: "flow",
                        color: '#ff680d',
                        speed: 2,
                        opacity: 1,
                        percent: 0.08,
                        gradient: 0.02,
                        width: 5,
                        data: {
                            coordinate: data
                        }
                    });
                })

                let line_image = layer.addFlowLine({
                    type: "image",
                        color: '#ffff00',
                        speed: 2,
                        opacity: 0.8,
                        width: 10,
                        image: "./arrow1.png",
                        textureFactor: 5,
                        towards: "ground",
                        data: {
                            coordinate: [[120.71624090321666, 31.314878668239686, 0.0], [120.71828649865898, 31.315091010863085, 0.0]]
                        }
                });
            }
        };
        map.addLayer(options);
    })
</script>
</body>
</html>