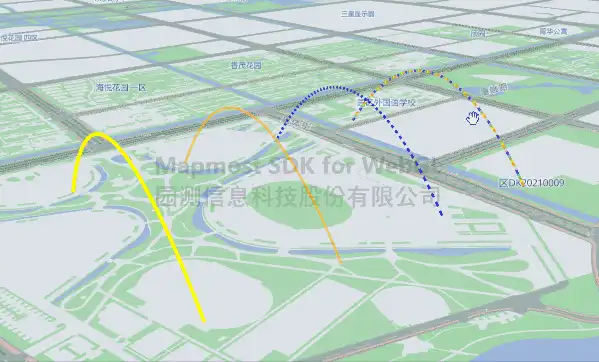
添加三维线
基于坐标点位构建三维线。
<!DOCTYPE html>
<html>

<head>
    <meta charset="utf-8"/>
    <title>添加三维线</title>
    <meta name="viewport" content="initial-scale=1,maximum-scale=1,user-scalable=no"/>
    <style>
        body {
            margin: 0;
            padding: 0;
        }

        #map {
            position: absolute;
            top: 0;
            bottom: 0;
            width: 100%;
        }

    </style>
    <script src="https://delivery.mapmost.com/cdn/sdk/webgl/v9.1.1/mapmost-webgl-min.js"></script>
    <script src="../../dist/js/Fun.js"></script>
</head>

<body>
<div id="map"></div>
<script>
    let map = new mapmost.Map({
        container: 'map',
        style: "<your style url>",
        center: [120.74603465203592, 31.30605899929158],
        zoom: 16.810035105070947,
        pitch: 60,
        bearing: 0,
        userId: '***', // 授权码
    });

 map.on('load', function () {

        // 生成贝塞尔曲线测试数据
        let data_pipe = getBSRPoints(120.74279465203592, 31.30505899929158, 120.74279465203592, 31.30905899929158, 300)
        let data_solid = getBSRPoints(120.74479465203592, 31.30505899929158, 120.74479465203592, 31.30905899929158, 300)
        let data_dash = getBSRPoints(120.74679465203592, 31.30505899929158, 120.74679465203592, 31.30905899929158, 300)
        let data_image = getBSRPoints(120.74879465203592, 31.30505899929158, 120.74879465203592, 31.30905899929158, 300)

         let options = {
            id: 'model_id',
            type: 'model',
            callback: function (group, layer) {
                let line_pipe = layer.addLines({
                    type: "pipe",
                    color: "#ffff00",
                    width: 5,
                    data: [{
                        coordinate: data_pipe
                    }]
                })
                let line_soild = layer.addLines({
                    type: "solid",
                    color: "#ffb536",
                    width: 10,
                    opacity: 0.8,
                    data: [{
                        coordinate: data_solid
                    }]
                })
                let line_dash = layer.addLines({
                    type: "dash",
                    color: "#0000ff",
                    width: 10,
                    opacity: 0.8,
                    data: [{
                        coordinate: data_dash
                    }]
                })
                let line_image = layer.addLines({
                    type: "image",
                    image: "../example_data/images/colors.png",
                    repeat: {x: 20, y: 1},
                    width: 10,
                    opacity: 0.8,
                    data: [{
                        coordinate: data_image
                    }]
                })
            }
         };
        map.addLayer(options);
    })
</script>
</body>

</html>