Migration map
The migration map displays the migration trajectory and magnitude of the data dynamically and in real time on the map, allowing you to visually view the source and destination of the data. Need to be introducedturf.js。
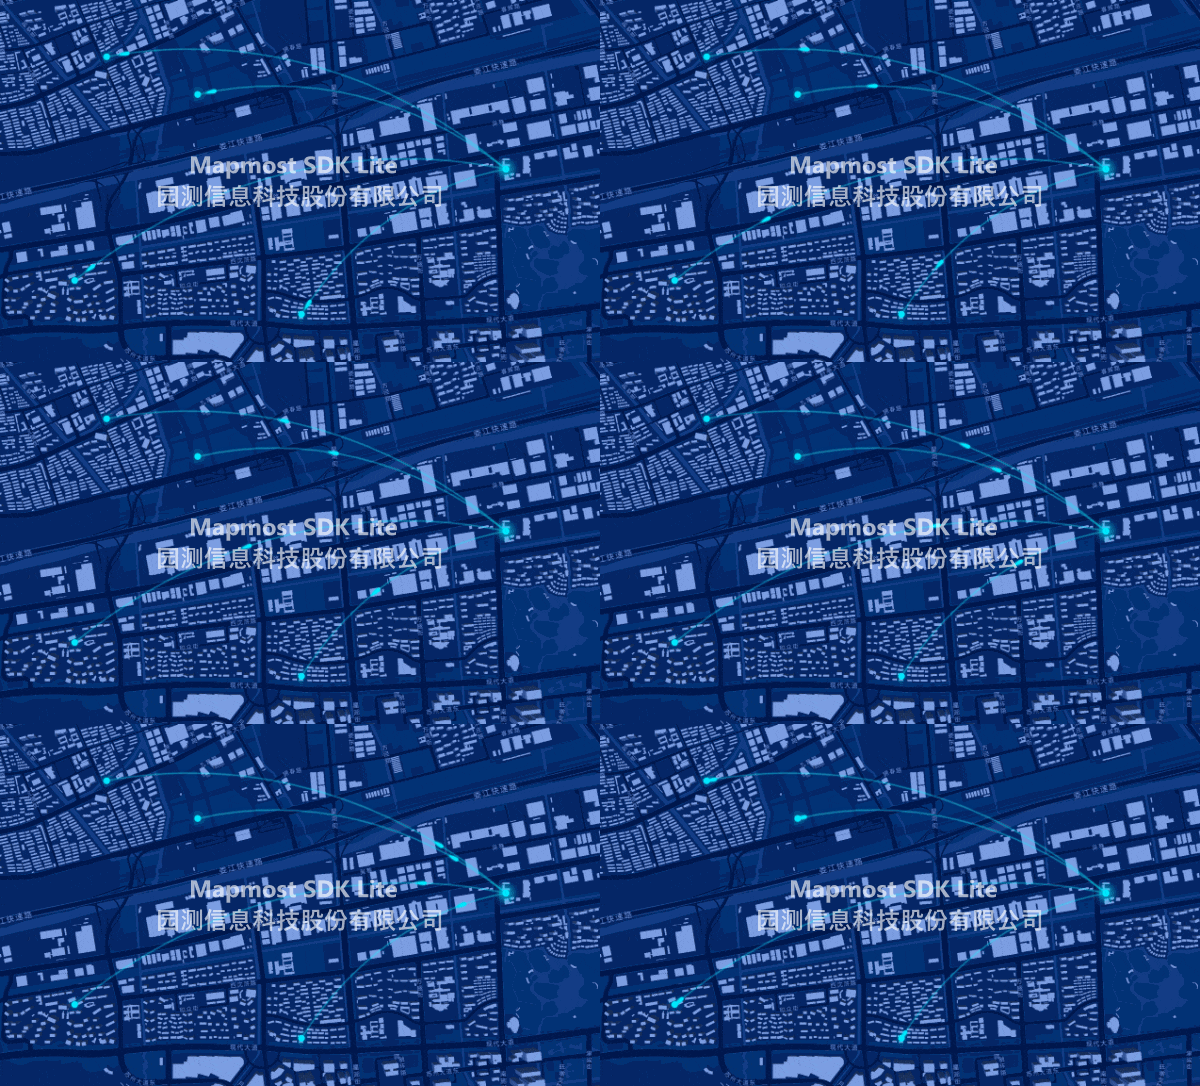
<!DOCTYPE html>
<html>
<head>
    <meta charset="utf-8"/>
    <title>Migration map</title>
    <meta name="viewport" content="initial-scale=1,maximum-scale=1,user-scalable=no"/>
    <style>
        body {
            margin: 0;
            padding: 0;
        }

        #map {
            position: absolute;
            top: 0;
            bottom: 0;
            width: 100%;
        }
    </style>
    <script src="https://delivery.mapmost.com/cdn/sdk/lite/v9.1.0/mapmost-lite-min.js"></script>
    <script src="https://unpkg.com/@turf/turf@6/turf.min.js"></script>
</head>
<body>
<div id="map"></div>
<script>
    let map = new mapmost.Map({
        container: 'map',
        style: "<your style url>",
        center: [120.70899820084962, 31.339048513540533],
        zoom: 14,
        pitch: 0,
        bearing: 0,
        userId: '***', // Authorization code,This parameter must be added
    });

    map.on('load', function () {
        // data
        let data = [
            {
                coords: [[120.70254950835465, 31.34452333816192], [120.72899820084962, 31.339048513540533]],
            },
            {
                coords: [[120.71146083590128, 31.328411691268002], [120.72899820084962, 31.339048513540533]],
            },
            {
                coords: [[120.6919983801705, 31.330883608912274], [120.72899820084962, 31.339048513540533]],
            },
            {
                coords: [[120.69473931280976, 31.347288081092003], [120.72899820084962, 31.339048513540533]],
            }];

        let a =  map.addMigrationLayer({
            id:'test',
            data:data,
            pointImgUrl:'./point.png'
        })

        map.on('click',function(){
            a.remove();
        })
    });
</script>
</body>
</html>