README
#3D heat map
Use heatmap-3d type layers to visualize the value of a certain attribute in different locations.
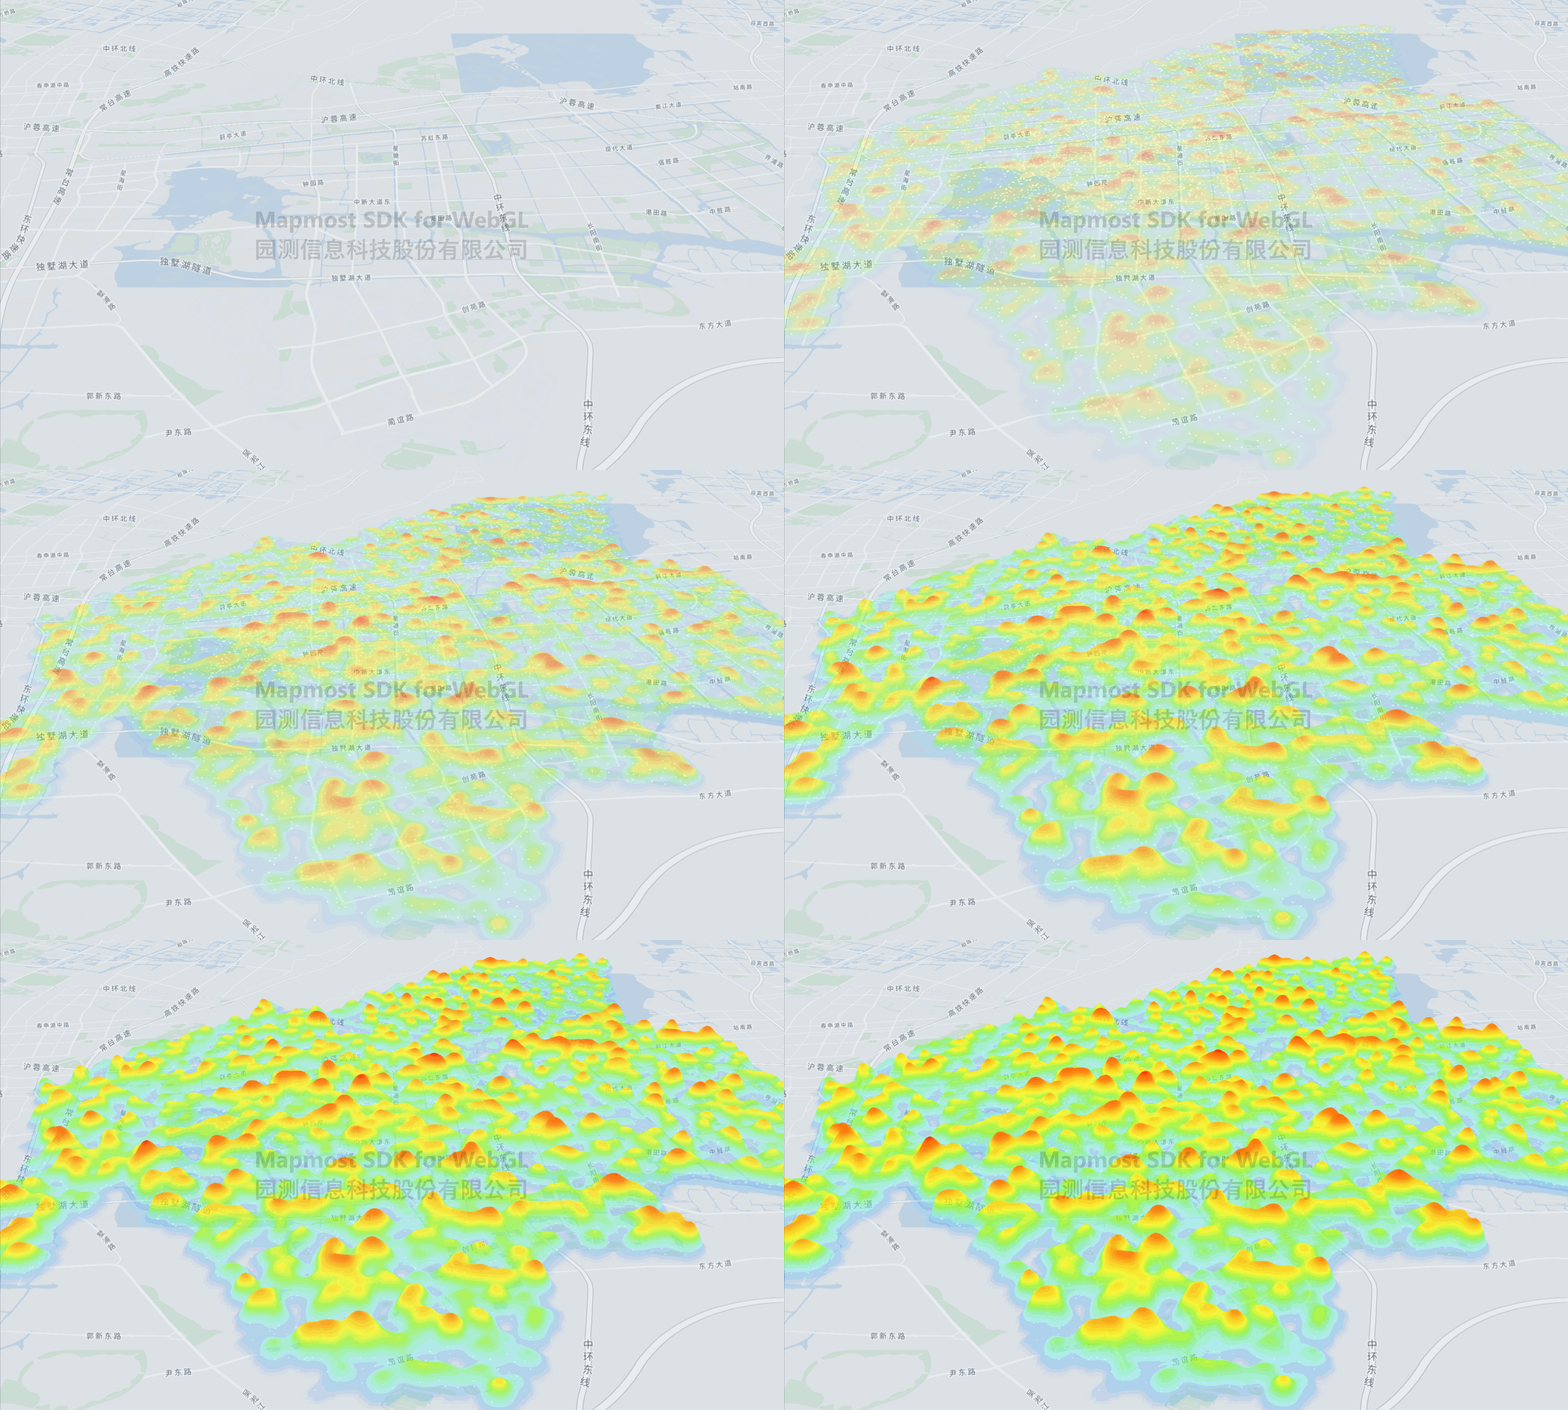
<!DOCTYPE html>
<html>
<head>
<meta charset="utf-8"/>
<title>3D Heat Map</title>
<meta name="viewport" content="initial-scale=1,maximum-scale=1,user-scalable=no"/>
<style>
body {
margin: 0;
padding: 0;
}
#map {
position: absolute;
top: 0;
bottom: 0;
width: 100%;
}
</style>
<script src="https://delivery.mapmost.com/cdn/sdk/lib/heatmap/heatmap.min.js"></script>
<script src="https://delivery.mapmost.com/cdn/sdk/webgl/v9.16.0/mapmost-webgl-min.js"></script>
</head>
<body>
<div id="map"></div>
<script>
let map = new mapmost.Map({
container: 'map',
style: "<your style url>",
center: [120.71930846, 31.2911422673],
zoom: 13,
pitch: 60,
bearing: 0,
userId: '***', // Authorization code
});
map.on('load', function () {
fetch('../example_data/random_points_3857.geojson').then(
res => res.json()
).then(response => {
let dataPoints = [];
response.features.map(item => {
let coor = item.geometry.coordinates;
dataPoints.push([coor[0], coor[1], item.properties.num])
})
let op = {
id: 'heatmap-3d-layer',
type: 'heatmap-3d',
data: dataPoints, // dataPoints = [[lon,lat,value]], the parameters are longitude, latitude, attribute value respectively
width: 256, //Heat map canvas width, default 256
heightRatio: 1000, // 3D heat map stretch height, default 100
// proj:"3857", // The coordinate system supports '3857' and '4326', the default is '4326'
blur: 0.85, // [0,1] Optional parameter default = 0.85, applied to all point data. The higher the coefficient, the smoother the gradient, the default is 0.85
radius: 4, // Radius of each data point, default 6
gradient: {
'0.1': 'rgb(0,102,255)',
'0.2': 'rgb(102,255,255)',
'0.3': 'rgb(102,255,153)',
'0.4': 'rgb(125,255,0)',
'0.5': 'rgb(255,255,0)',
'0.6': 'rgb(255,204,0)',
'0.7': 'rgb(255,128,0)',
'0.8': 'rgb(255,102,0)',
'0.9': 'rgb(255,0,0)',
}, // The ribbon object representing the gradient, if not set, the default style will be used
// sleep: 3, // Animation delay start time, unit seconds, used in conjunction with speed
speed: 1, //Initial display animation speed
maxValue: 15000, // Define the maximum weight value in the data set, which is used to normalize color mapping and determine the upper limit of color, corresponding to the value attribute value in the parameter data.
// minValue:1000 // Define the minimum weight value in the data set, which is used to normalize color mapping and determine the lower limit of color. It corresponds to the value attribute value in the parameter data. Points with attribute values lower than minValue are not rendered.
};
map.addLayer(op);
})
});
</script>
</body>
</html>