README
#3D real-time heat map
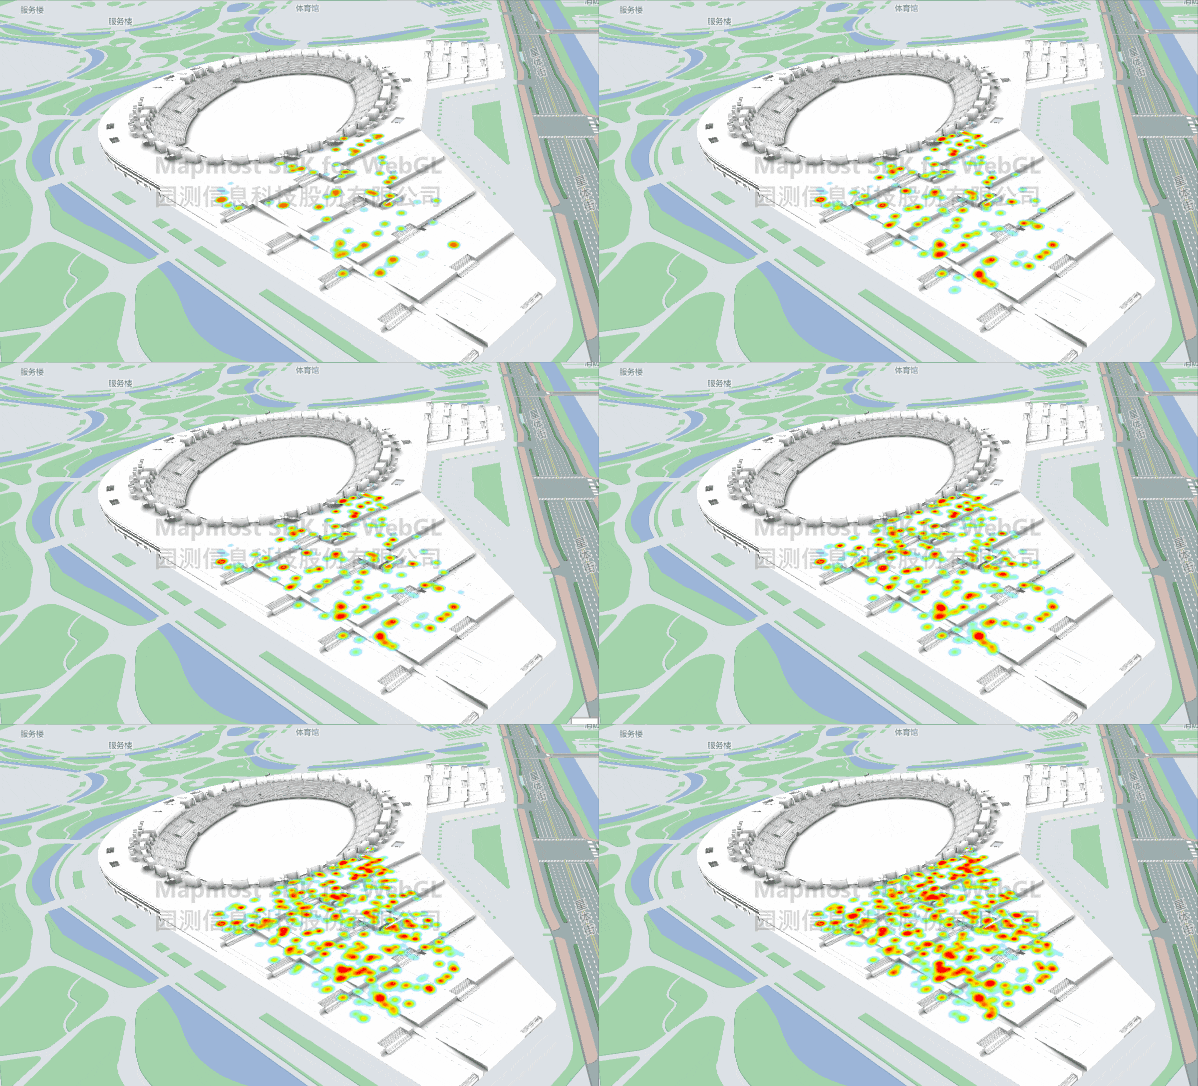
Use the heatmap-3d type layer to visualize certain attribute values in different locations, and support real-time refresh of the heat map.
<!DOCTYPE html>
<html>
<head>
    <meta charset="utf-8"/>
    <title>3D real-time heat map</title>
    <meta name="viewport" content="initial-scale=1,maximum-scale=1,user-scalable=no"/>
    <style>
        body {
            margin: 0;
            padding: 0;
        }

        #map {
            position: absolute;
            top: 0;
            bottom: 0;
            width: 100%;
        }
    </style>
     <script src="https://delivery.mapmost.com/cdn/sdk/lib/heatmap/heatmap.min.js"></script>
    <script src="https://delivery.mapmost.com/cdn/sdk/webgl/v9.16.0/mapmost-webgl-min.js"></script>
    <script src="./heatmap_points.js"></script>
</head>
<body>
<div id="map"></div>
<script>
    let map = new mapmost.Map({
        container: 'map',
        style: "<your style url>",
        center: [120.71930846, 31.2911422673],
        zoom: 13,
        pitch: 60,
        bearing: 0,
        userId: '***', // Authorization code
        env3D:{
            exposure: 0.72,
        }
    });

    let modelLayer;
    let funupdate;
    map.on('load', function () {

        let models_obj = ["../example_data/Olympic.glb"].map(item => ({
            type: 'glb',
            url: item
        }));
        let options = {
            id: 'model_id',
            type: 'model',
            models: models_obj,
            center: [120.74602465203592, 31.30630899929158, 0.0],
            callback: function (group, layer) {
                modelLayer = layer;
            }
        };
        map.addLayer(options);

        let coordinates = [
            [120.74567212933215, 31.305317764384963, 18],
            [120.74655989341419, 31.306298692900455, 18],
            [120.74770939504327, 31.30550295684141, 5],
            [120.7468333907371, 31.304524300958015, 5]
        ]

        let dataPoints = [];
        DATA2.map(item => {
            let coor = item.geometry.coordinates;
            dataPoints.push([coor[0], coor[1], 100 * Math.random()])
        })

        let dataPoints_ = dataPoints.slice(0, 100);

        let op = {
            id: 'b123',
            type: 'heatmap-3d',
            data: dataPoints_, // dataPoints = [[lon,lat,value]], the parameters are longitude, latitude, attribute value respectively
            coordinates: coordinates,
            width: 512, //Heat map container width, default 256
            heightRatio: 0.01, // 3D heat map stretch height, default 100
            proj: "4326", // The coordinate system supports '3857' and '4326', the default is '4326'
            blur: 0.85, // [0,1] Optional parameter default = 0.85, applied to all point data. The higher the coefficient, the smoother the gradient, the default is 0.85
            radius: 10, // Radius of each data point, default 6
            widthSegments: 500, //Number of width segments, default 300, the larger the value, the more detailed the heat map will be
            heightSegments: 500, //Number of length segments, default 300, the larger the value, the more detailed the heat map will be
            gradient: {
                '0.1': 'rgb(0,102,255)',
                '0.2': 'rgb(102,255,255)',
                '0.3': 'rgb(102,255,153)',
                '0.4': 'rgb(125,255,0)',
                '0.5': 'rgb(255,255,0)',
                '0.6': 'rgb(255,204,0)',
                '0.7': 'rgb(255,128,0)',
                '0.8': 'rgb(255,102,0)',
                '0.9': 'rgb(255,0,0)',
            }, // The ribbon object representing the gradient, if not set, the default style will be used
            callback(object, layer, updateHeatmap) {
                object.setRotation({x: -2, y: -4, z: 0})
                funupdate = updateHeatmap
            }
        };

        map.addLayer(op);

        map.on('click', function (e) {
            let count = 1;
            setInterval(function () {
                let c = count % 5;
                funupdate(dataPoints.slice(0, 100 * (c + 1)))
                count++;
            }, 1000)
        })

      });
</script>
</body>
</html>