Map Creation Guide
This module includes data processing, database connection, data service publishing, and map mapping. It is a complete step for mapping from scratch;
- The data in this case are all from the open source data of the OSM website, and the sample content is open source data download and software installation;
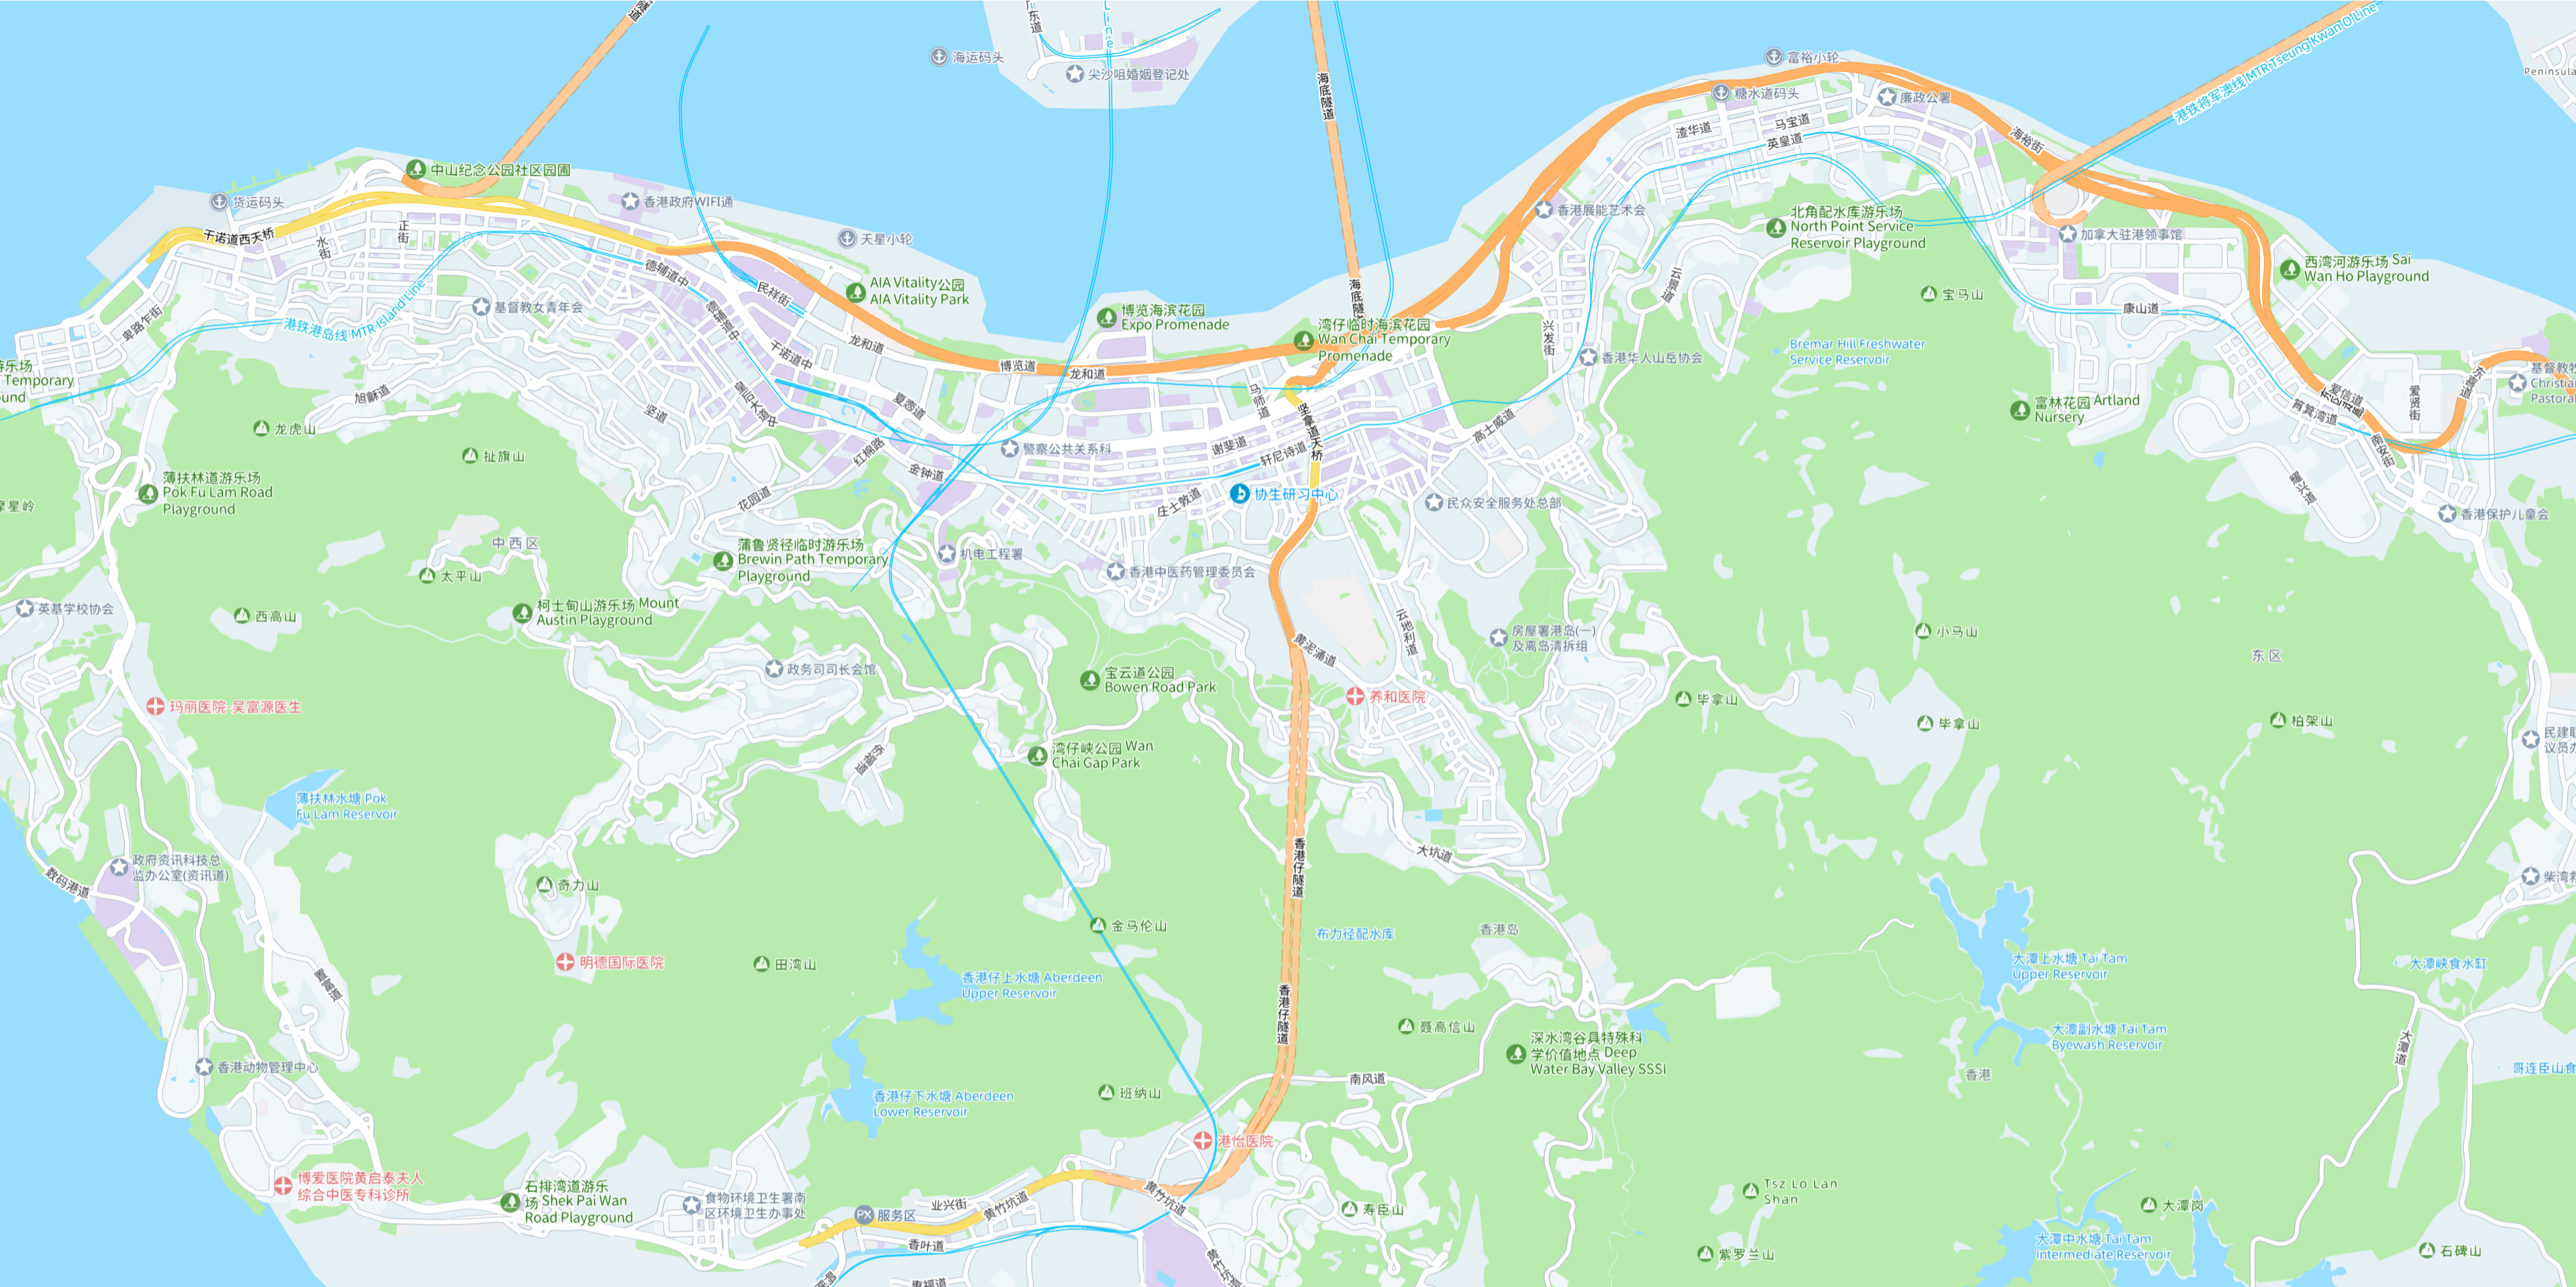
- Case data location: Central and Western District, Wan Chai District, Eastern District, Southern District of Hong Kong;
- Case software used: QGIS 3.36.3;
1. Data processing
Data processing is to solve the problem of data redundancy and data coordinate system inconsistency, and it is a step that cannot be ignored;
1.1. QGIS loading data
- Open QGIS and place all the shp files of the data in the QGIS software;
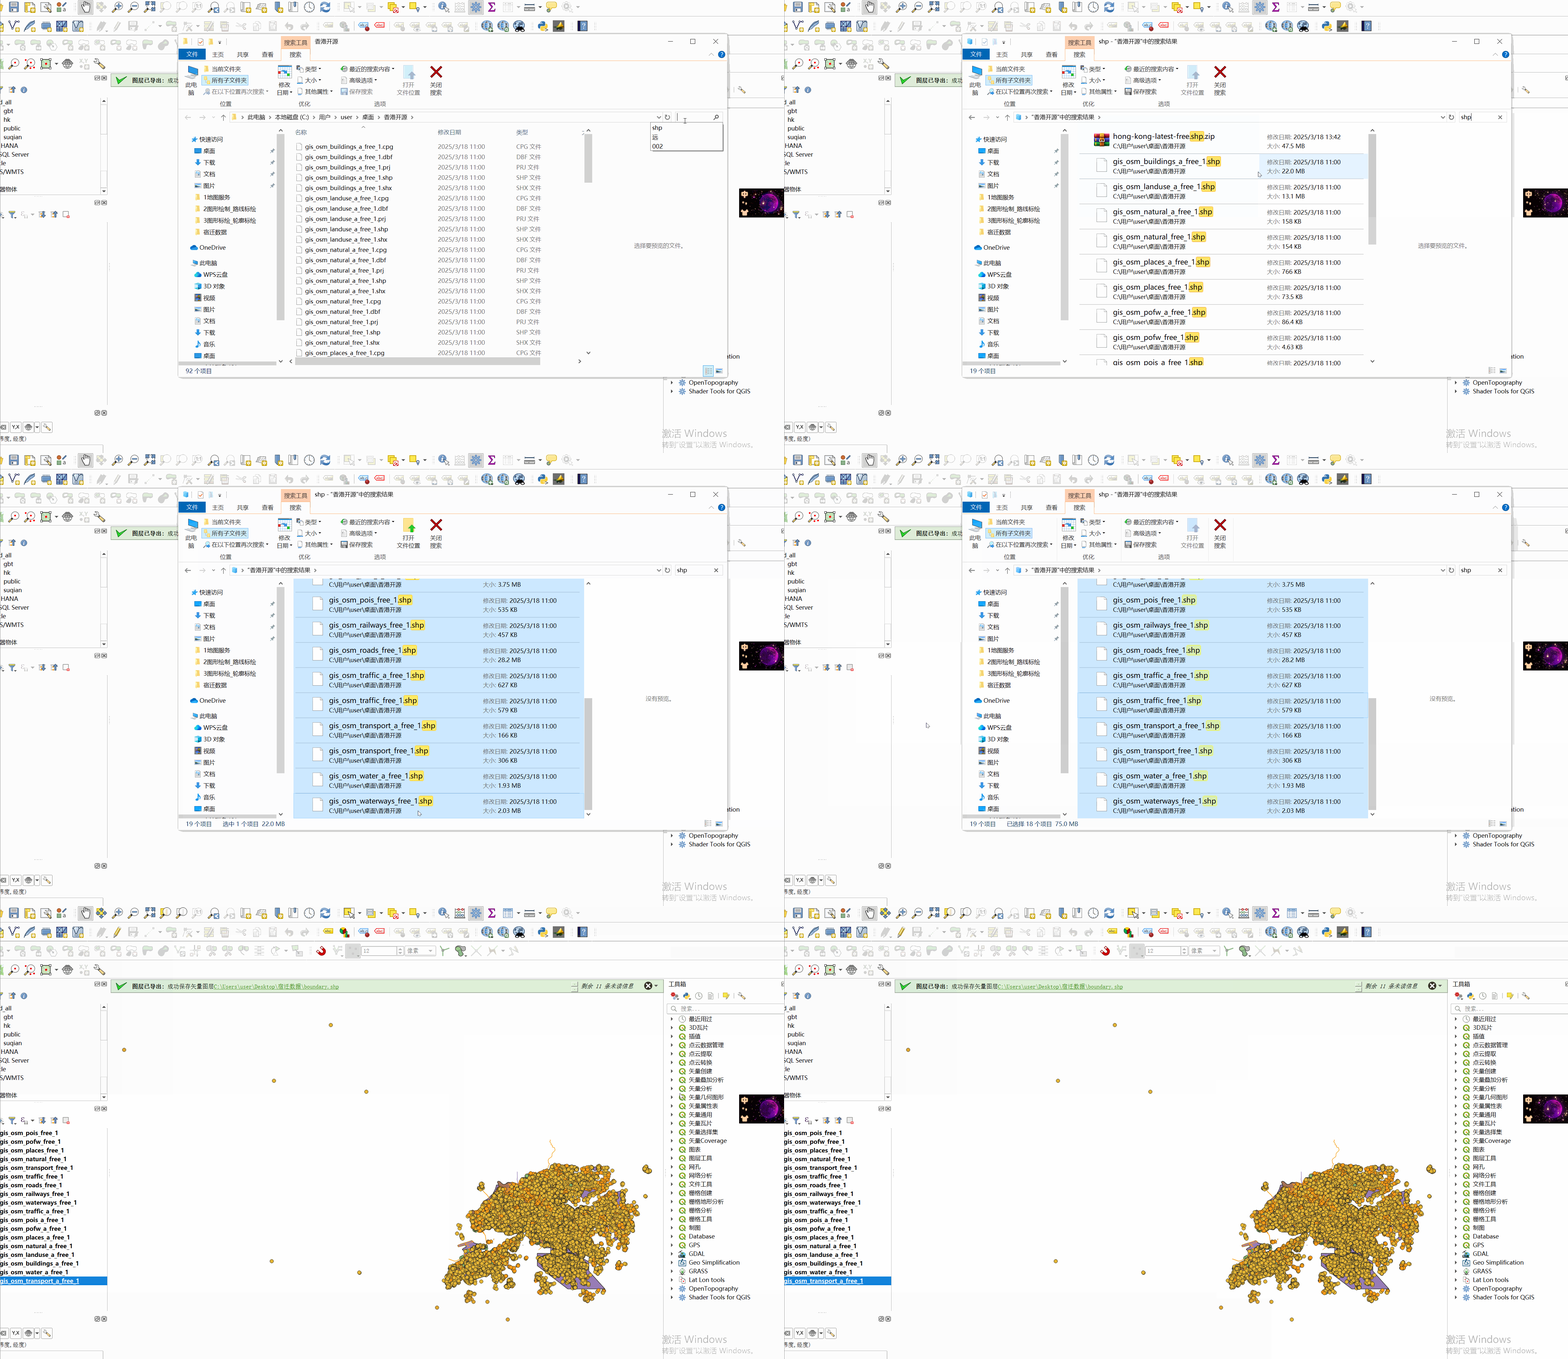
1.2. Cut data range
- Use administrative boundaries to trim the data scope;
- Perform this step for each layer;
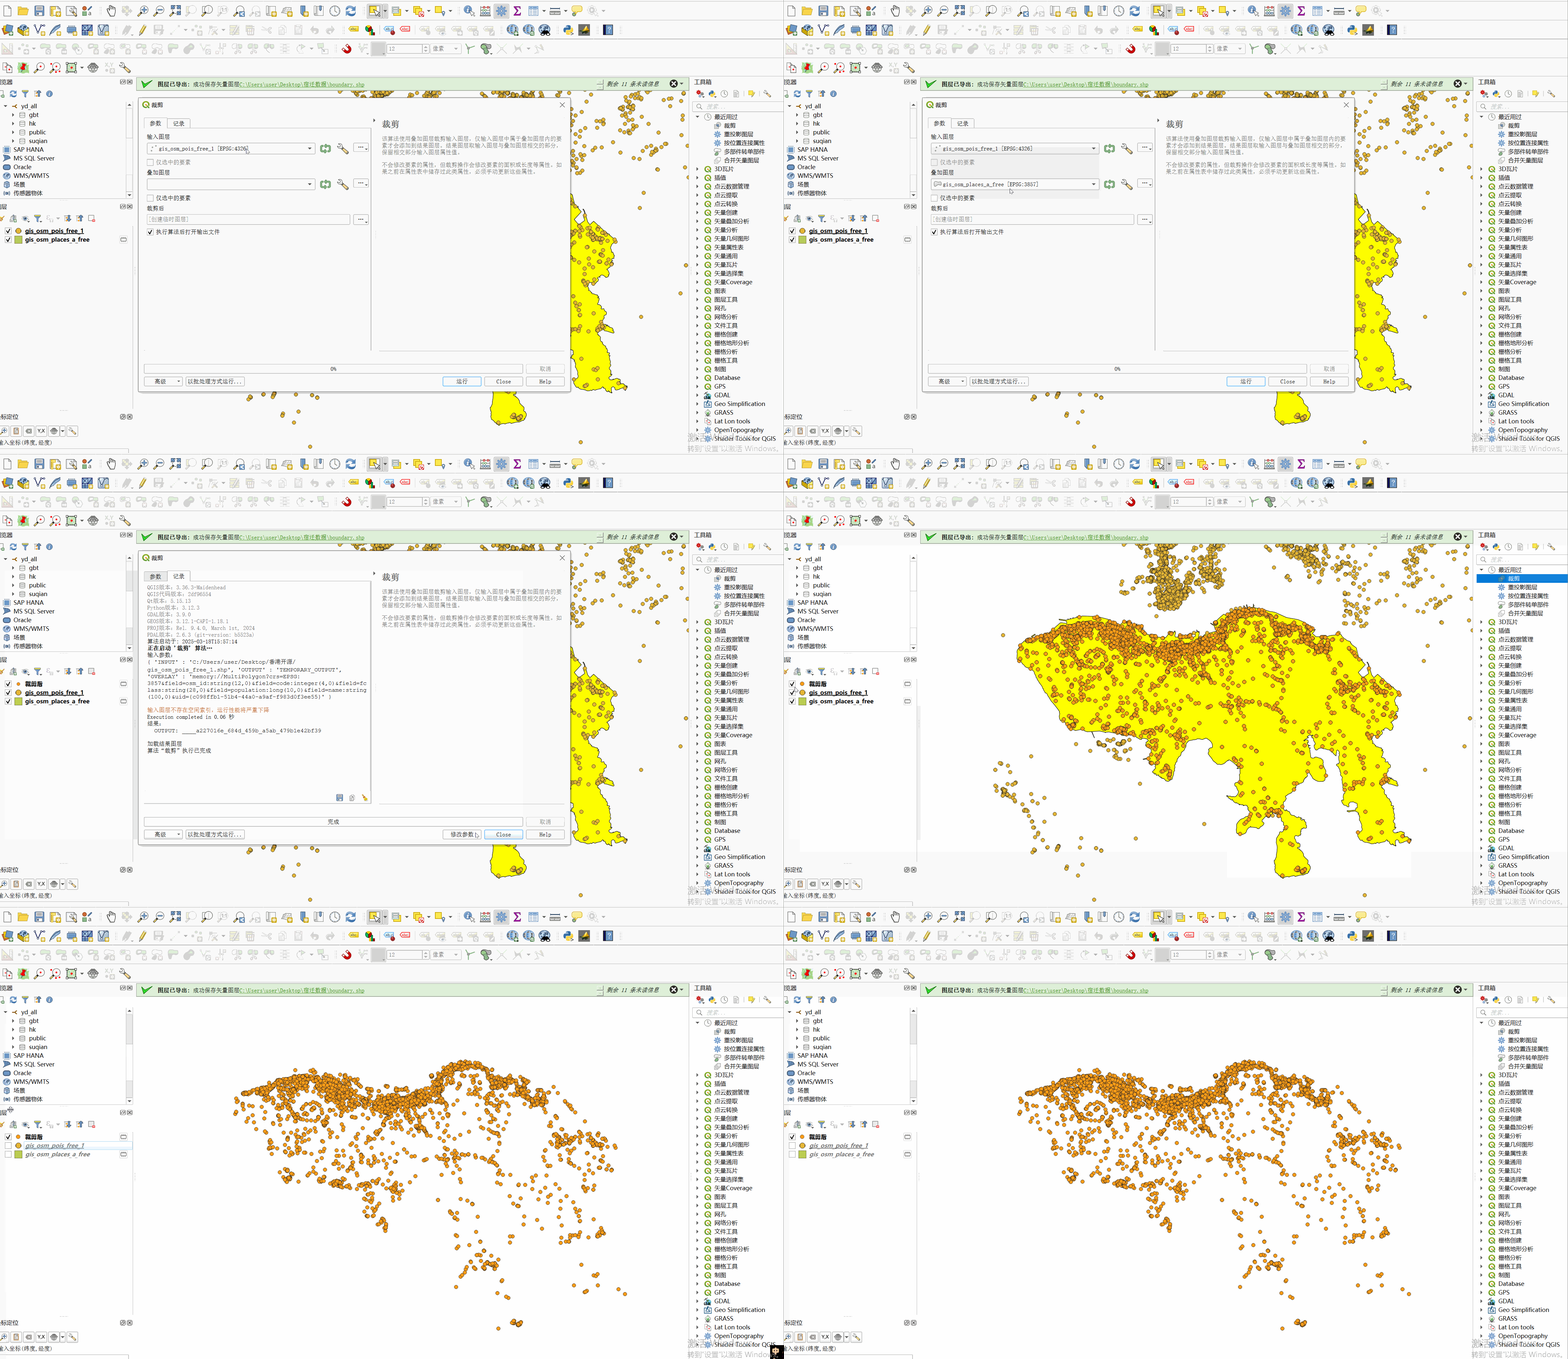
1.3. Coordinate reprojection
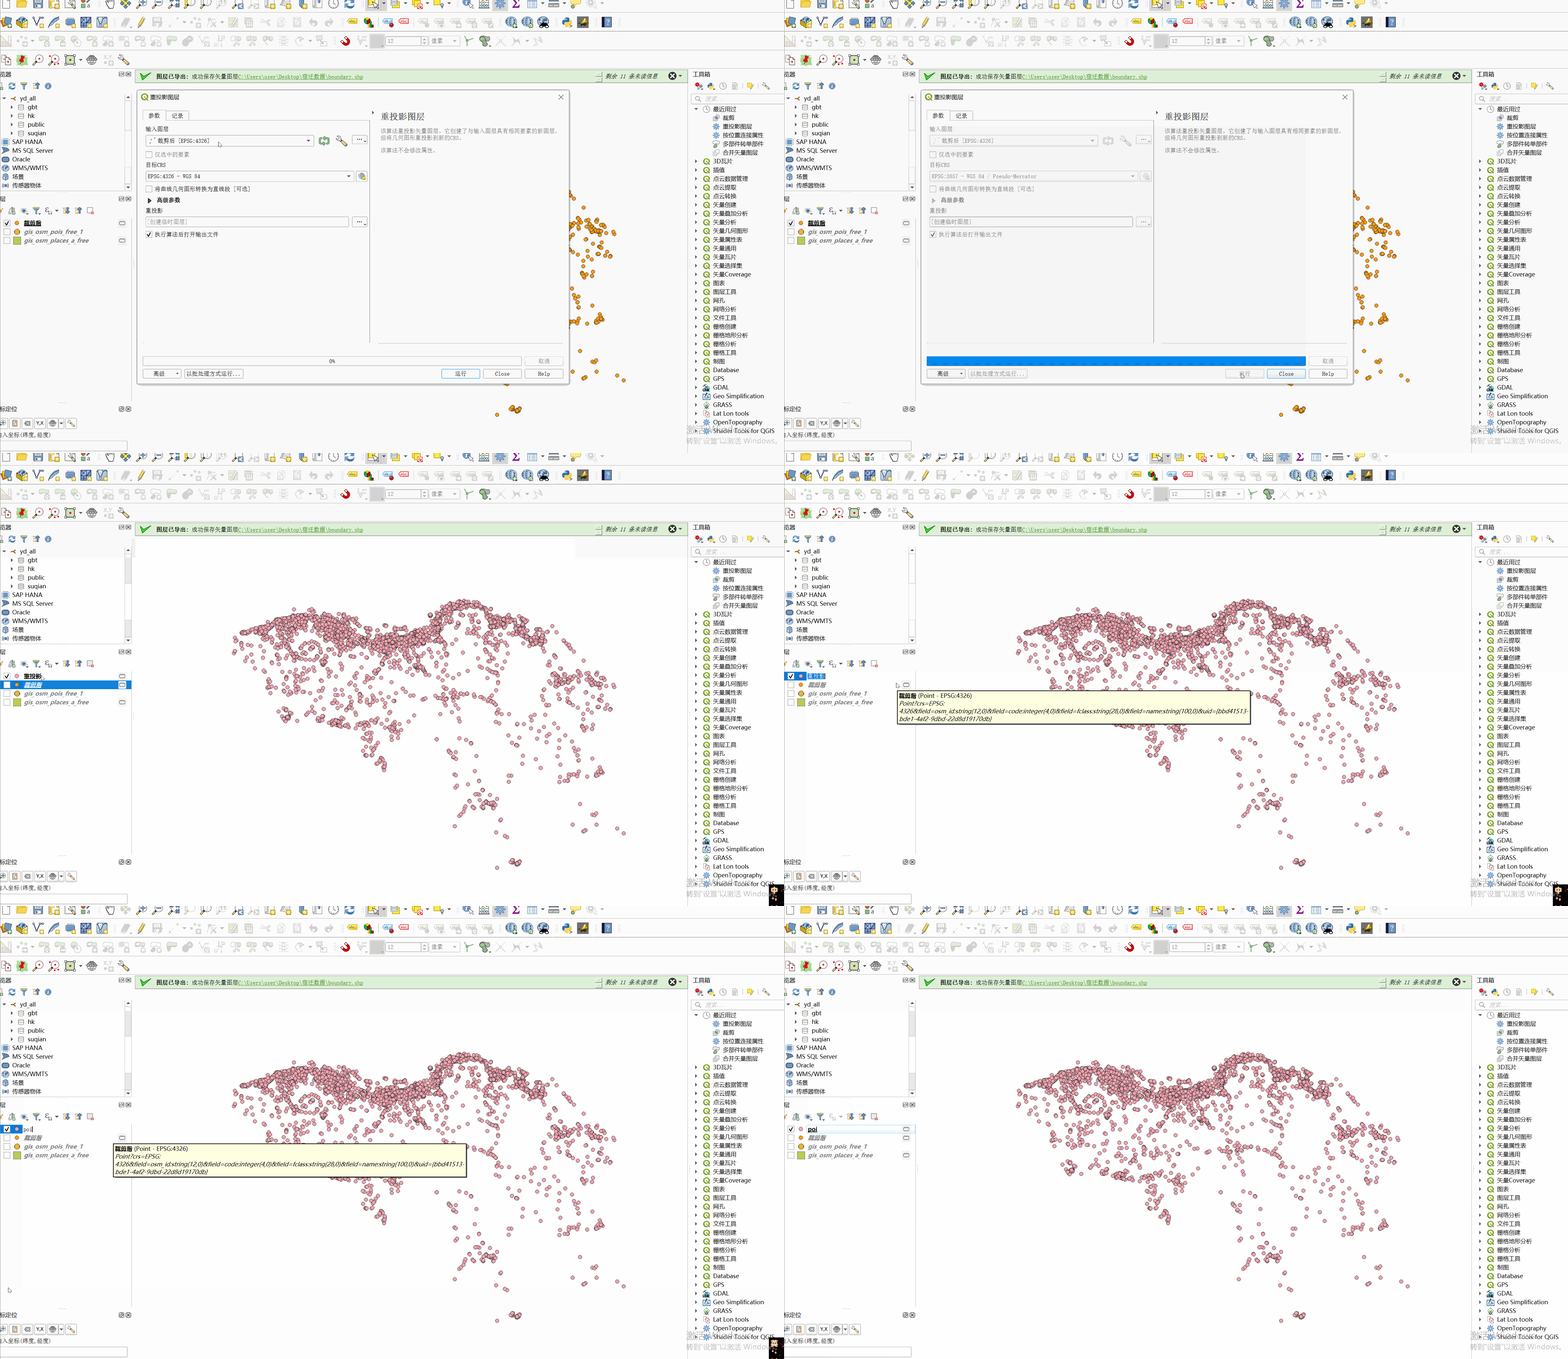
- In order to make the data coordinates consistent, the coordinate system of the data is EPSG:3857;
- Standardize layer naming;
- Perform this step for each layer;
1.4. Organize data forms
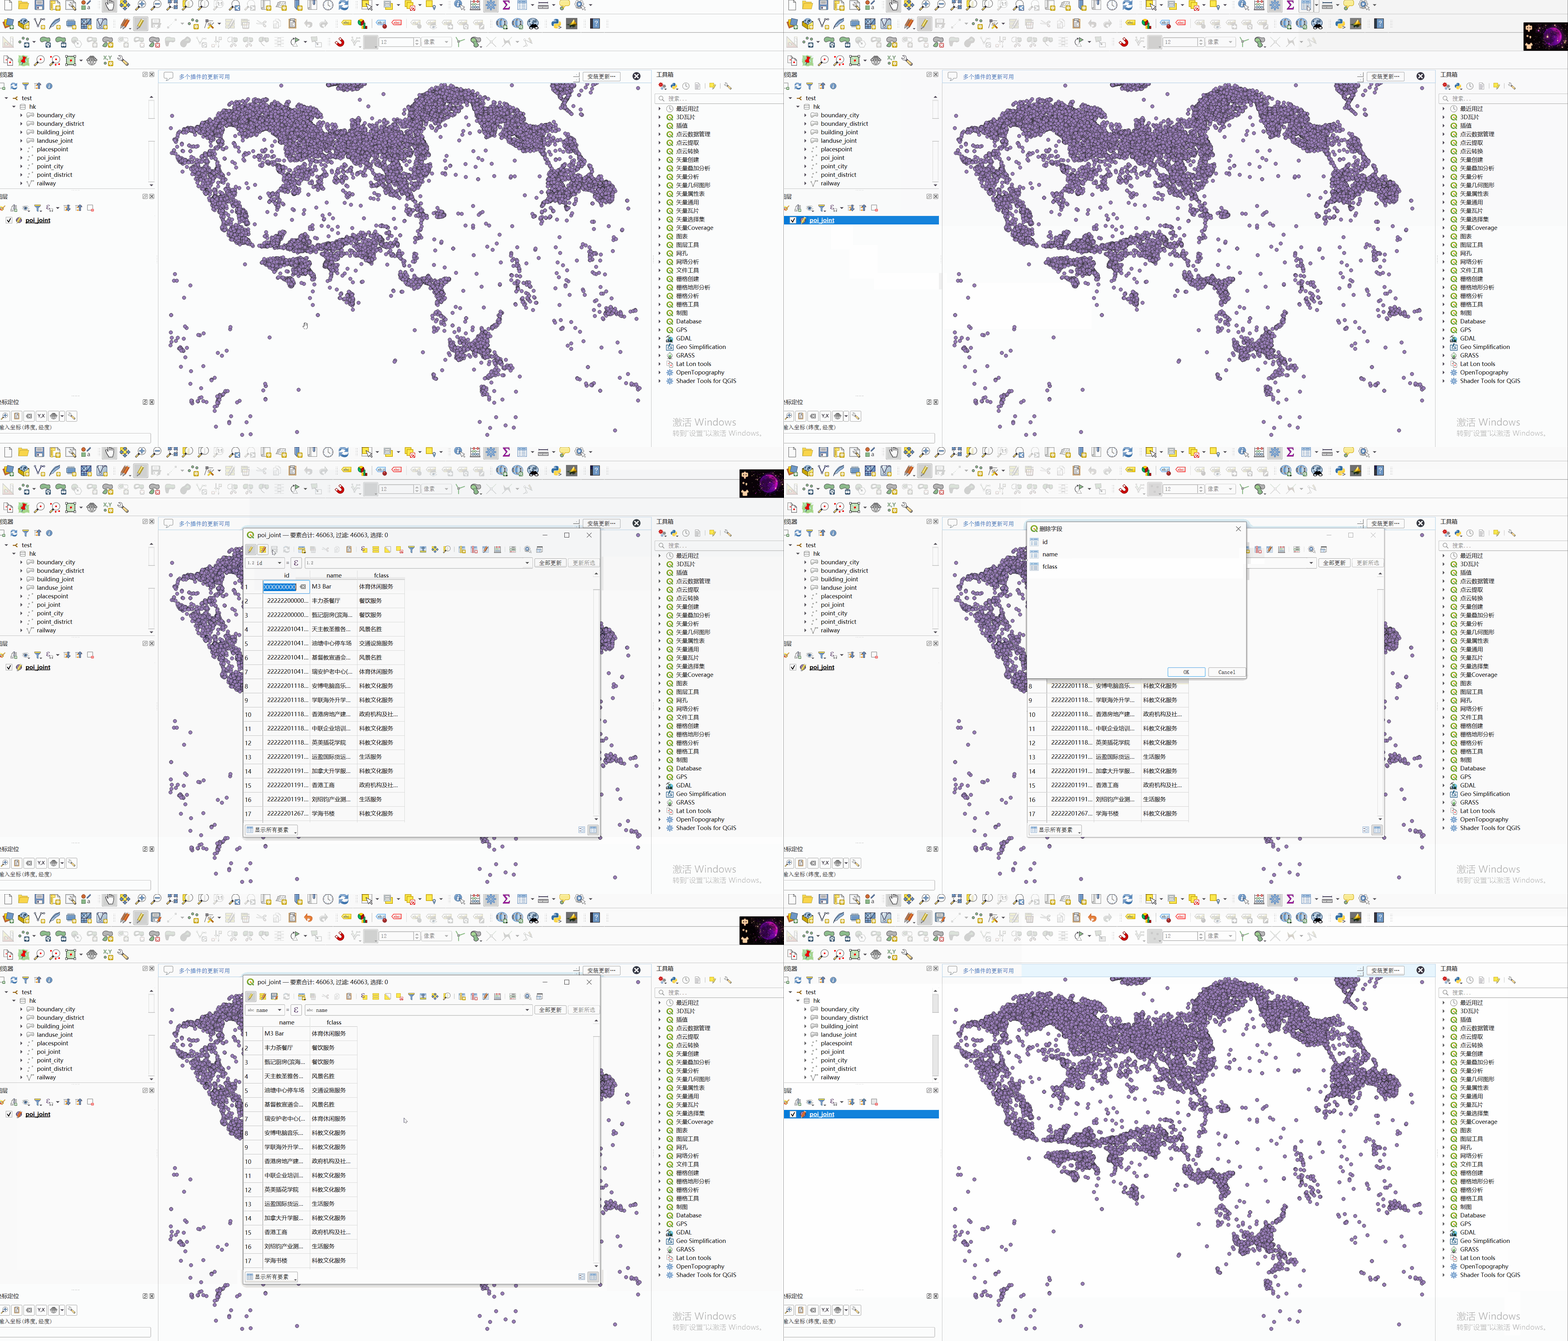
- Delete the "id" field and redundant fields;
- Perform this step for each layer;
2. Data storage
The organized data needs to be placed in the database, and you need to connect to this database when publishing data services;
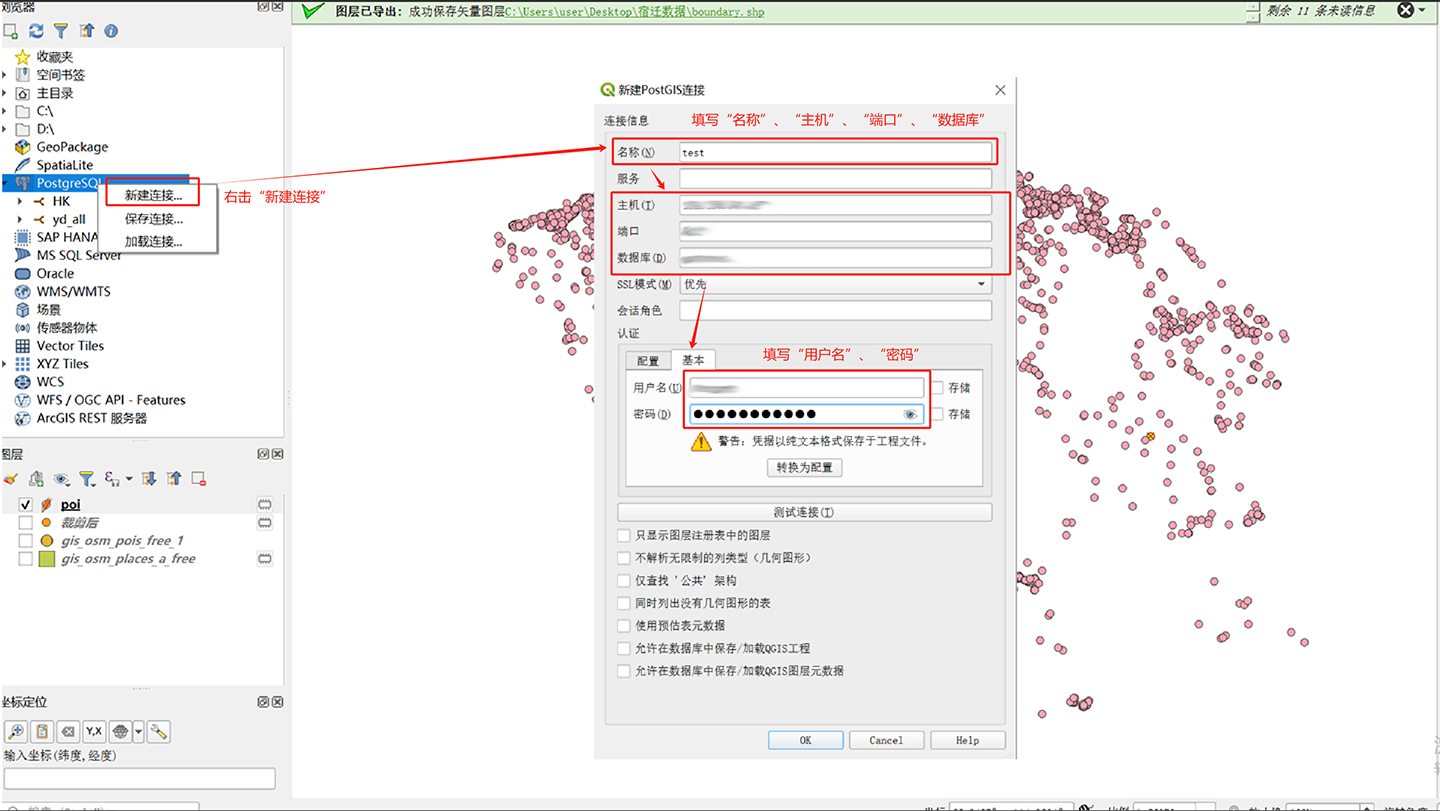
2.1. Create a new database connection in QGIS
- Right-click the database, enter the database information, and connect to the database;
- There should be no "spaces" in the account number and password used to connect to the database;
2.2. "Create a new schema" in the database
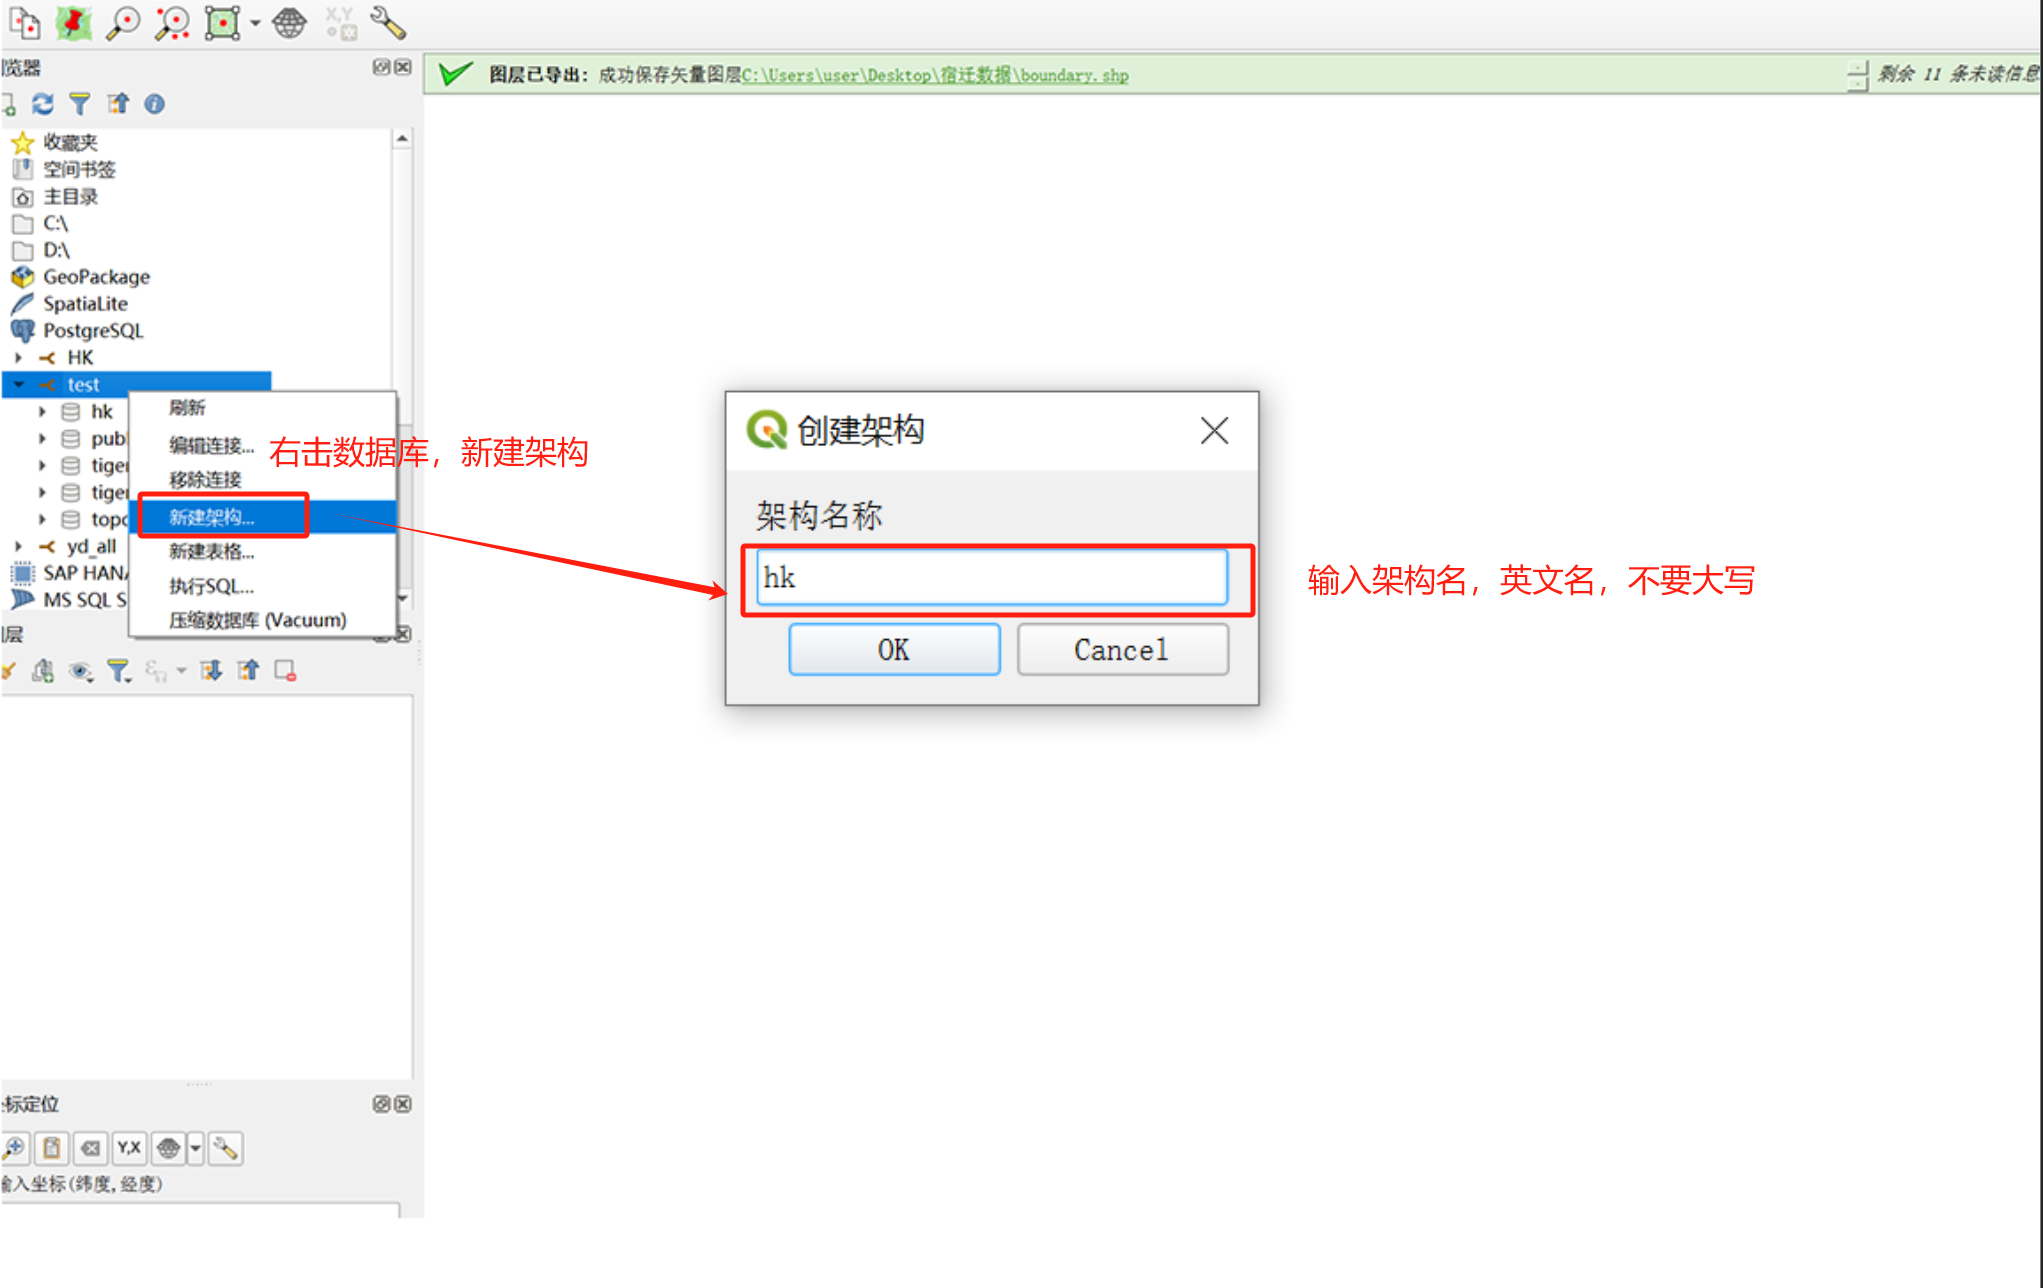
- Right-click PostgreSQL, create a new schema, and customize the schema name;
- Do not use Chinese or English capital letters for the name of the architecture;
2.3. Upload data to the database
- Single-select/multi-select the processed data layer, drag it to the database, and complete the data upload;

3. Publish a vector map service
Publish vector map services in Mapmost Studio;
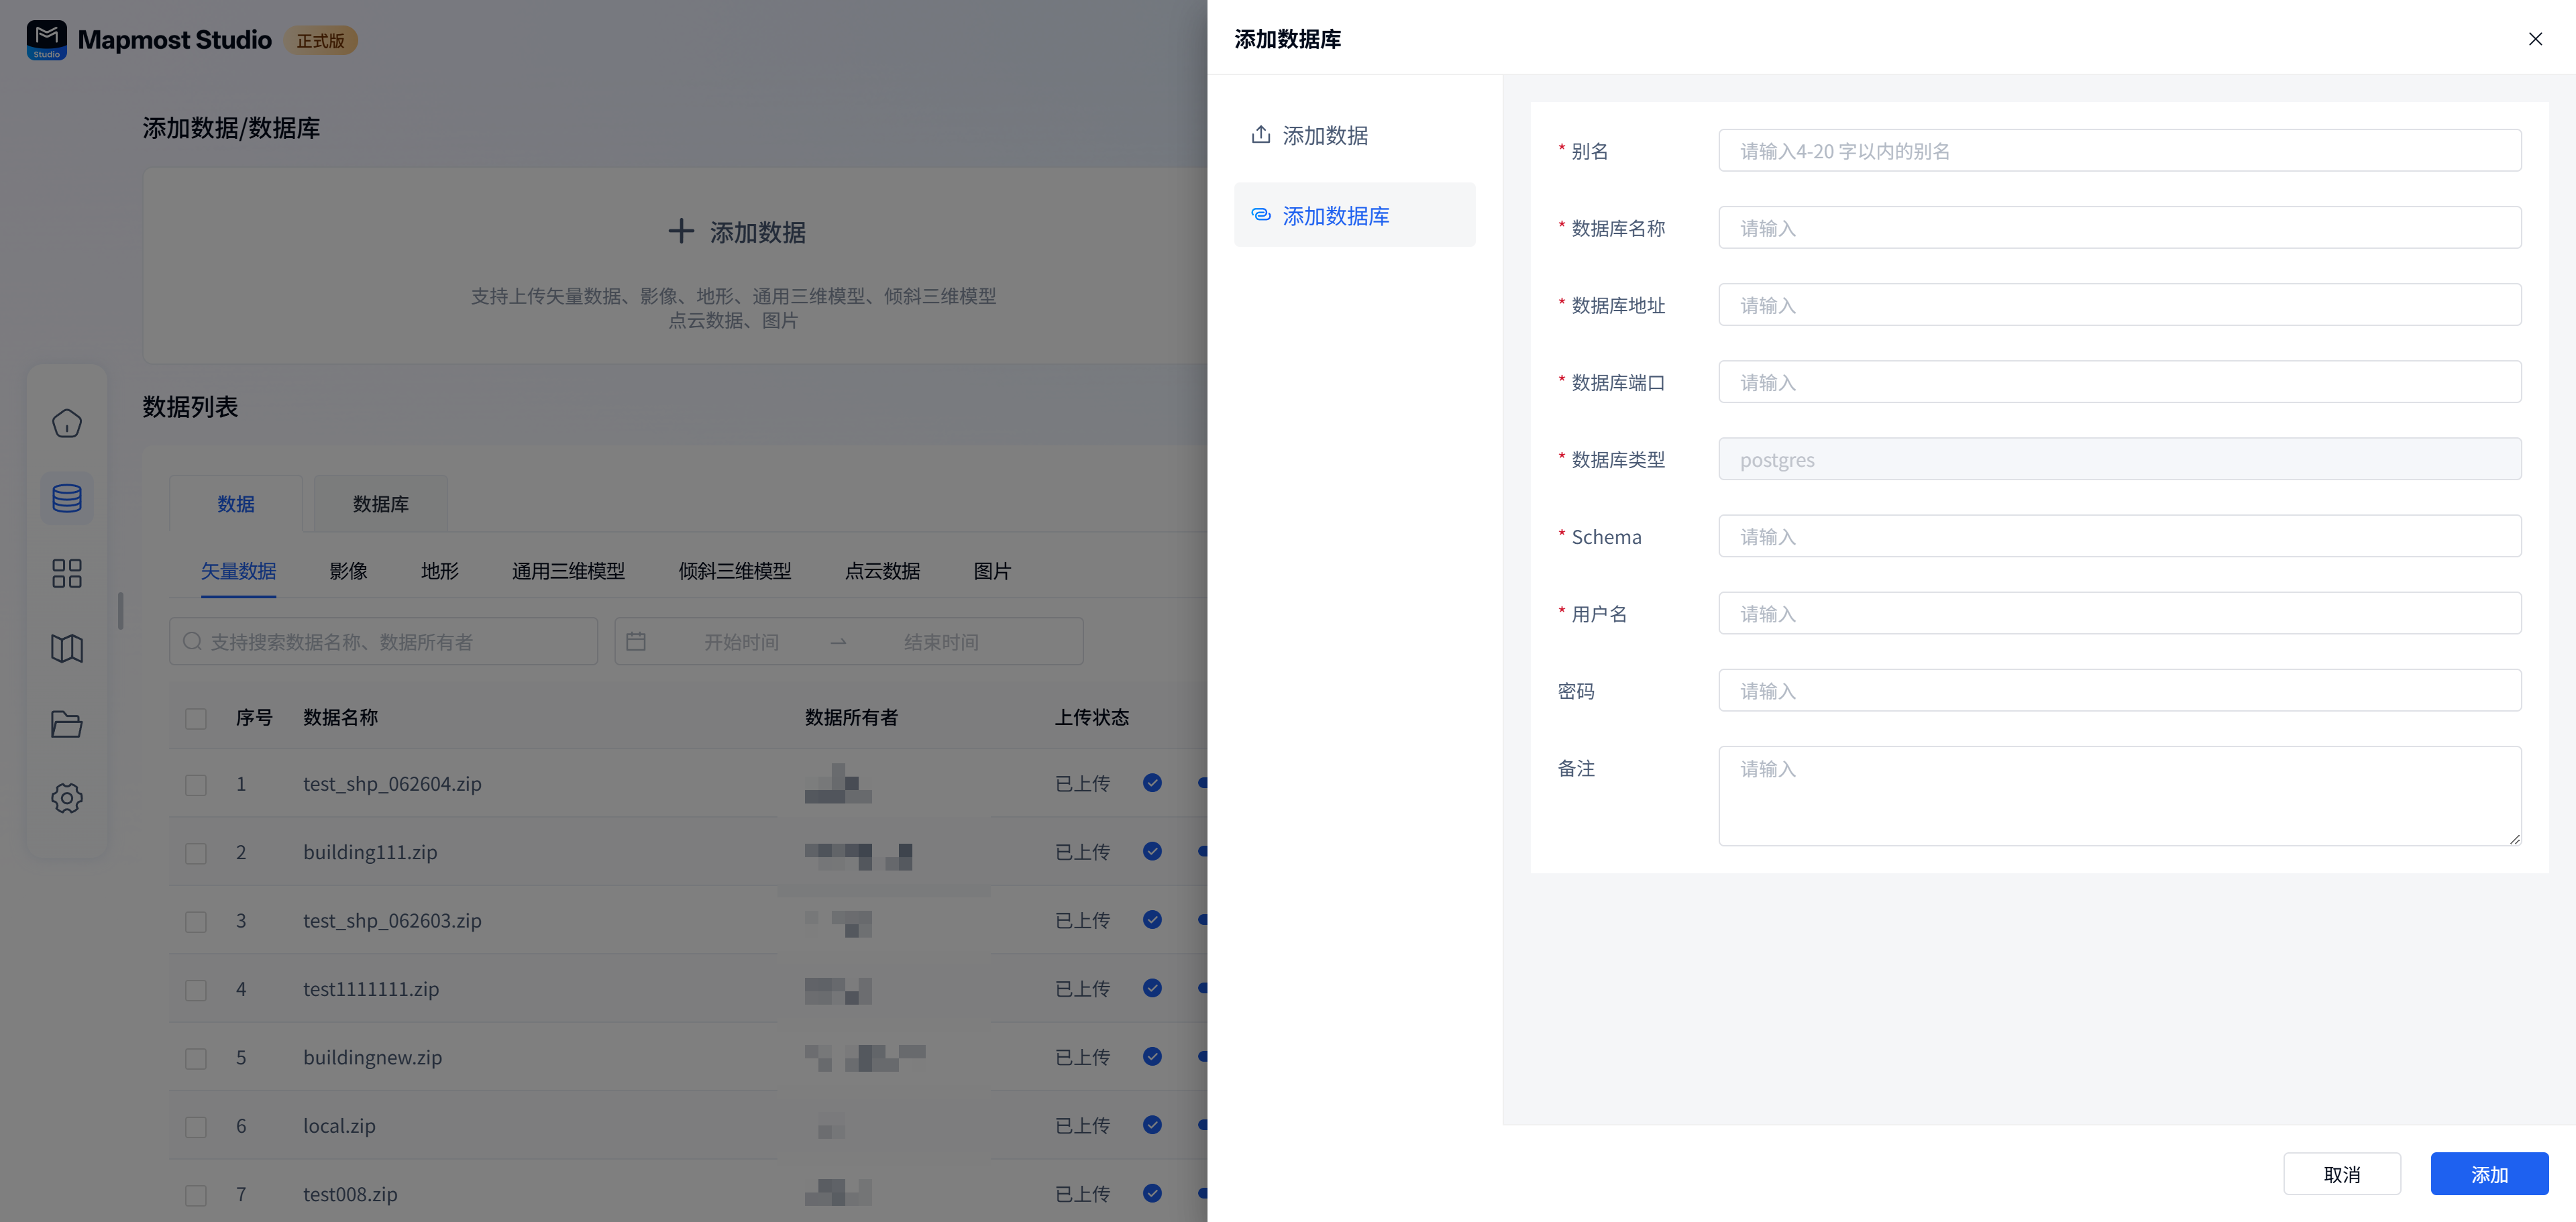
3.1 Add database
- Go to the Mapmost Studio homepage, click Add Data/Database, select Add Database, fill in the relevant database information, and click OK to complete the database addition.
3.2. Publishing services
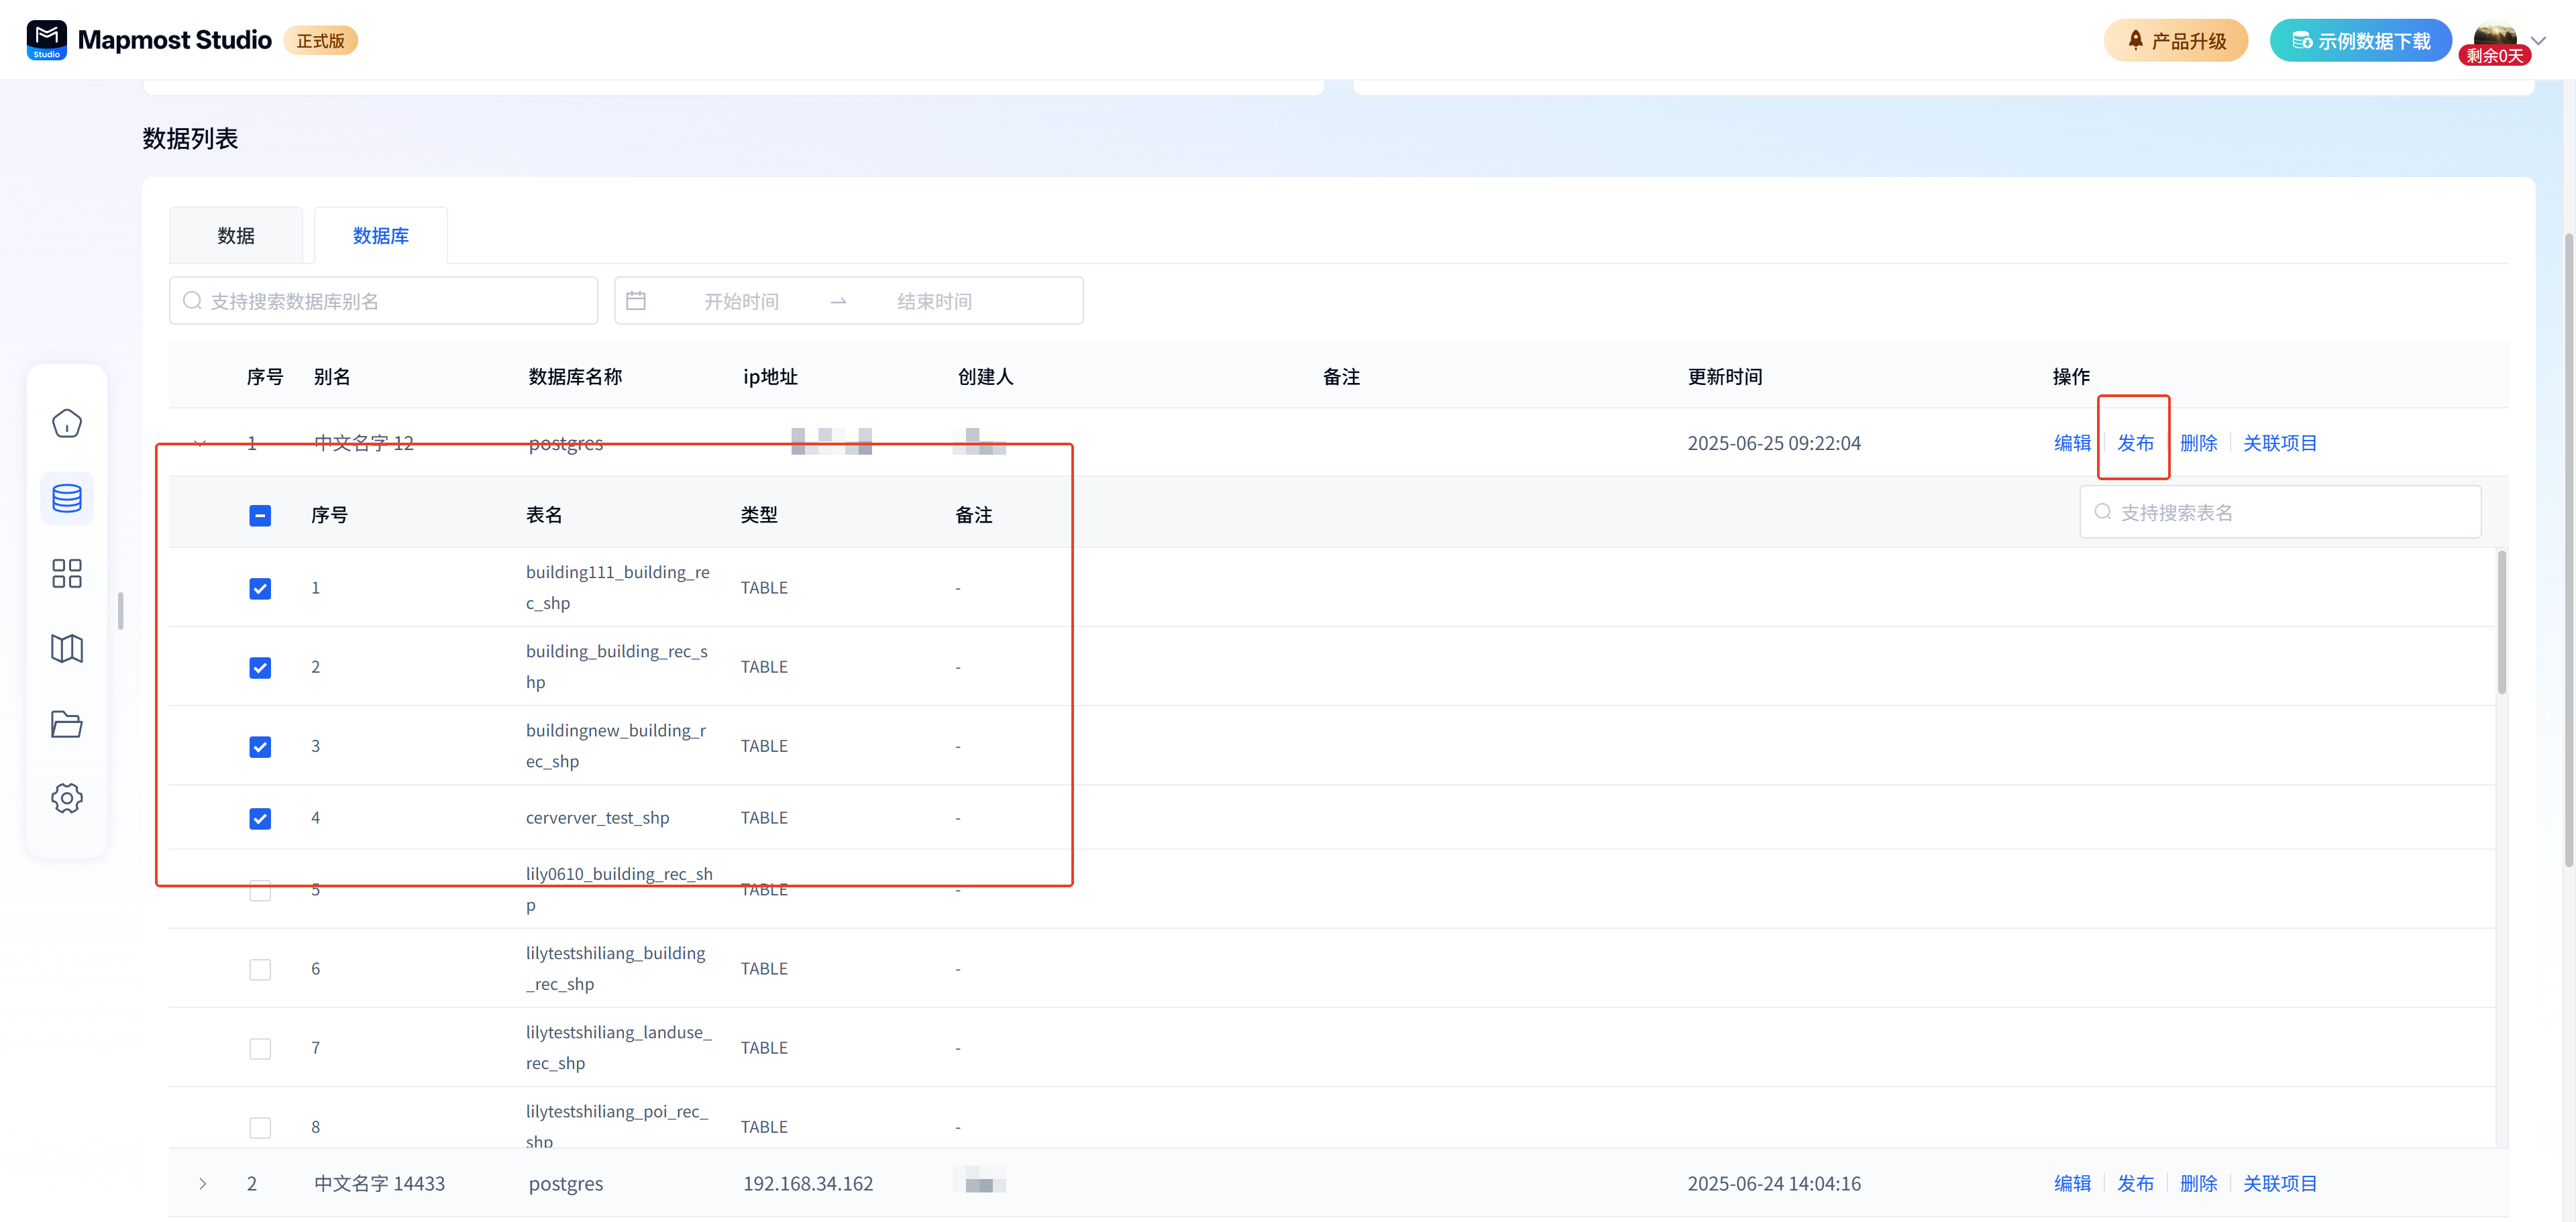
3.2.1. Select data layer
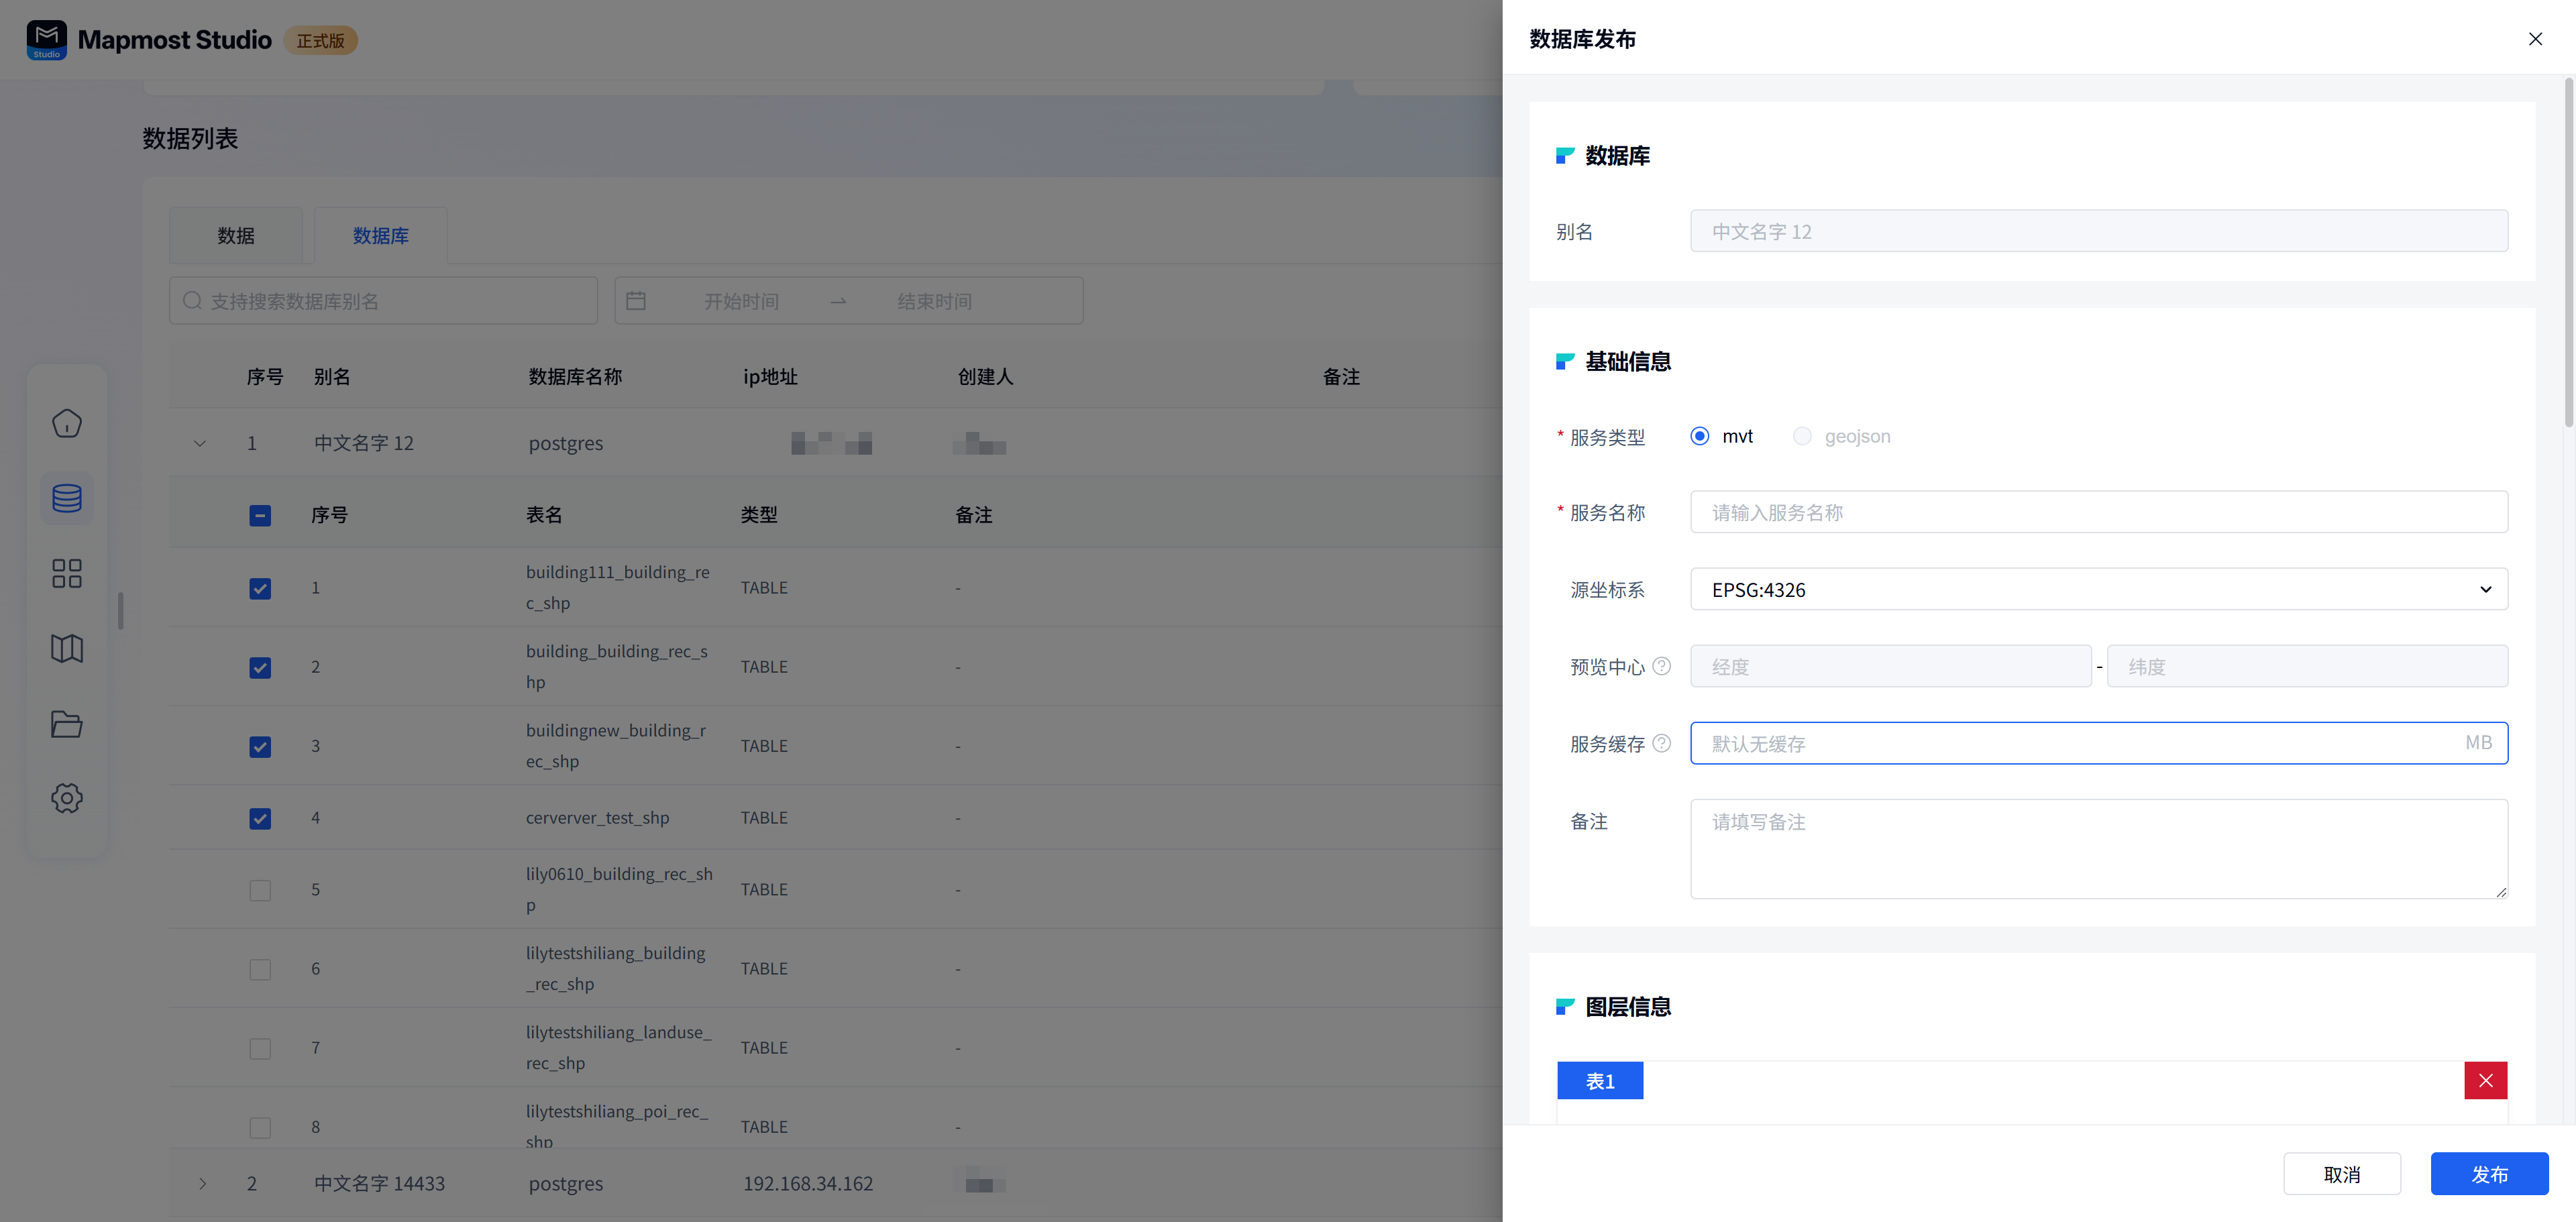
- In "My Data - Database List", select the newly connected database and the vector data to be published, and click Publish. The vector map service publishing page will pop up.
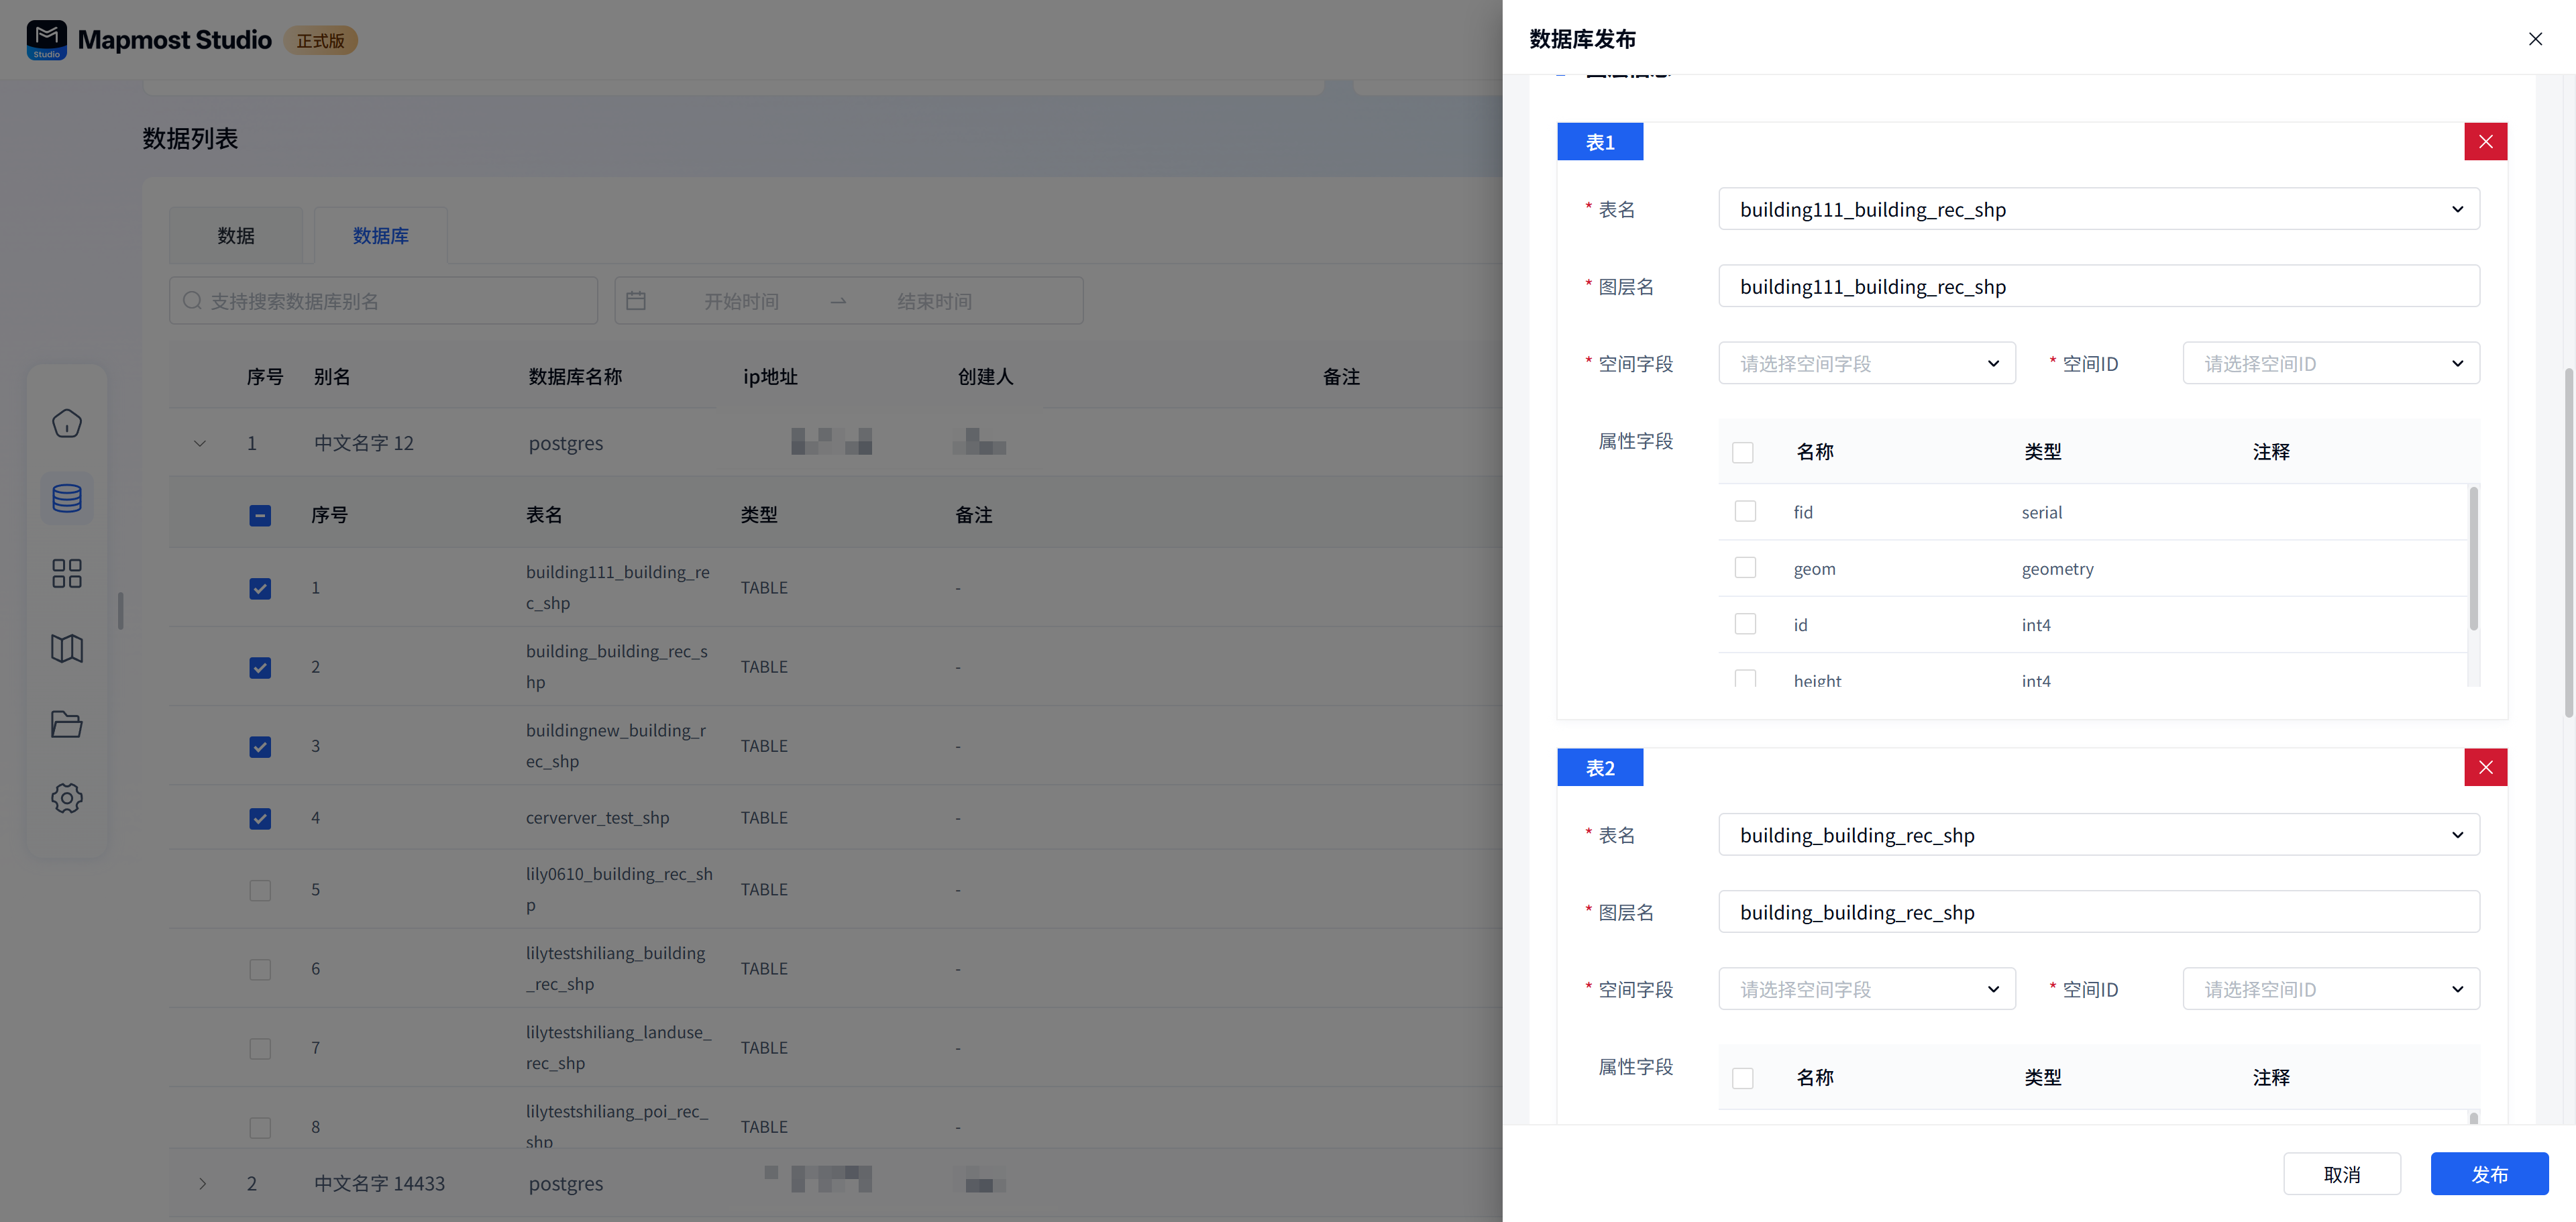
3.2.2. Configure service information
- Configure the "basic information" and "layer information" of the service on the vector map service publishing page. After completing the information configuration, click Publish to complete the service publishing.
4. Vector graphics initialization settings
Obtain the service and configure the map initialization parameters;
4.1. Add data source
4.1.1. Copy "Service Address"
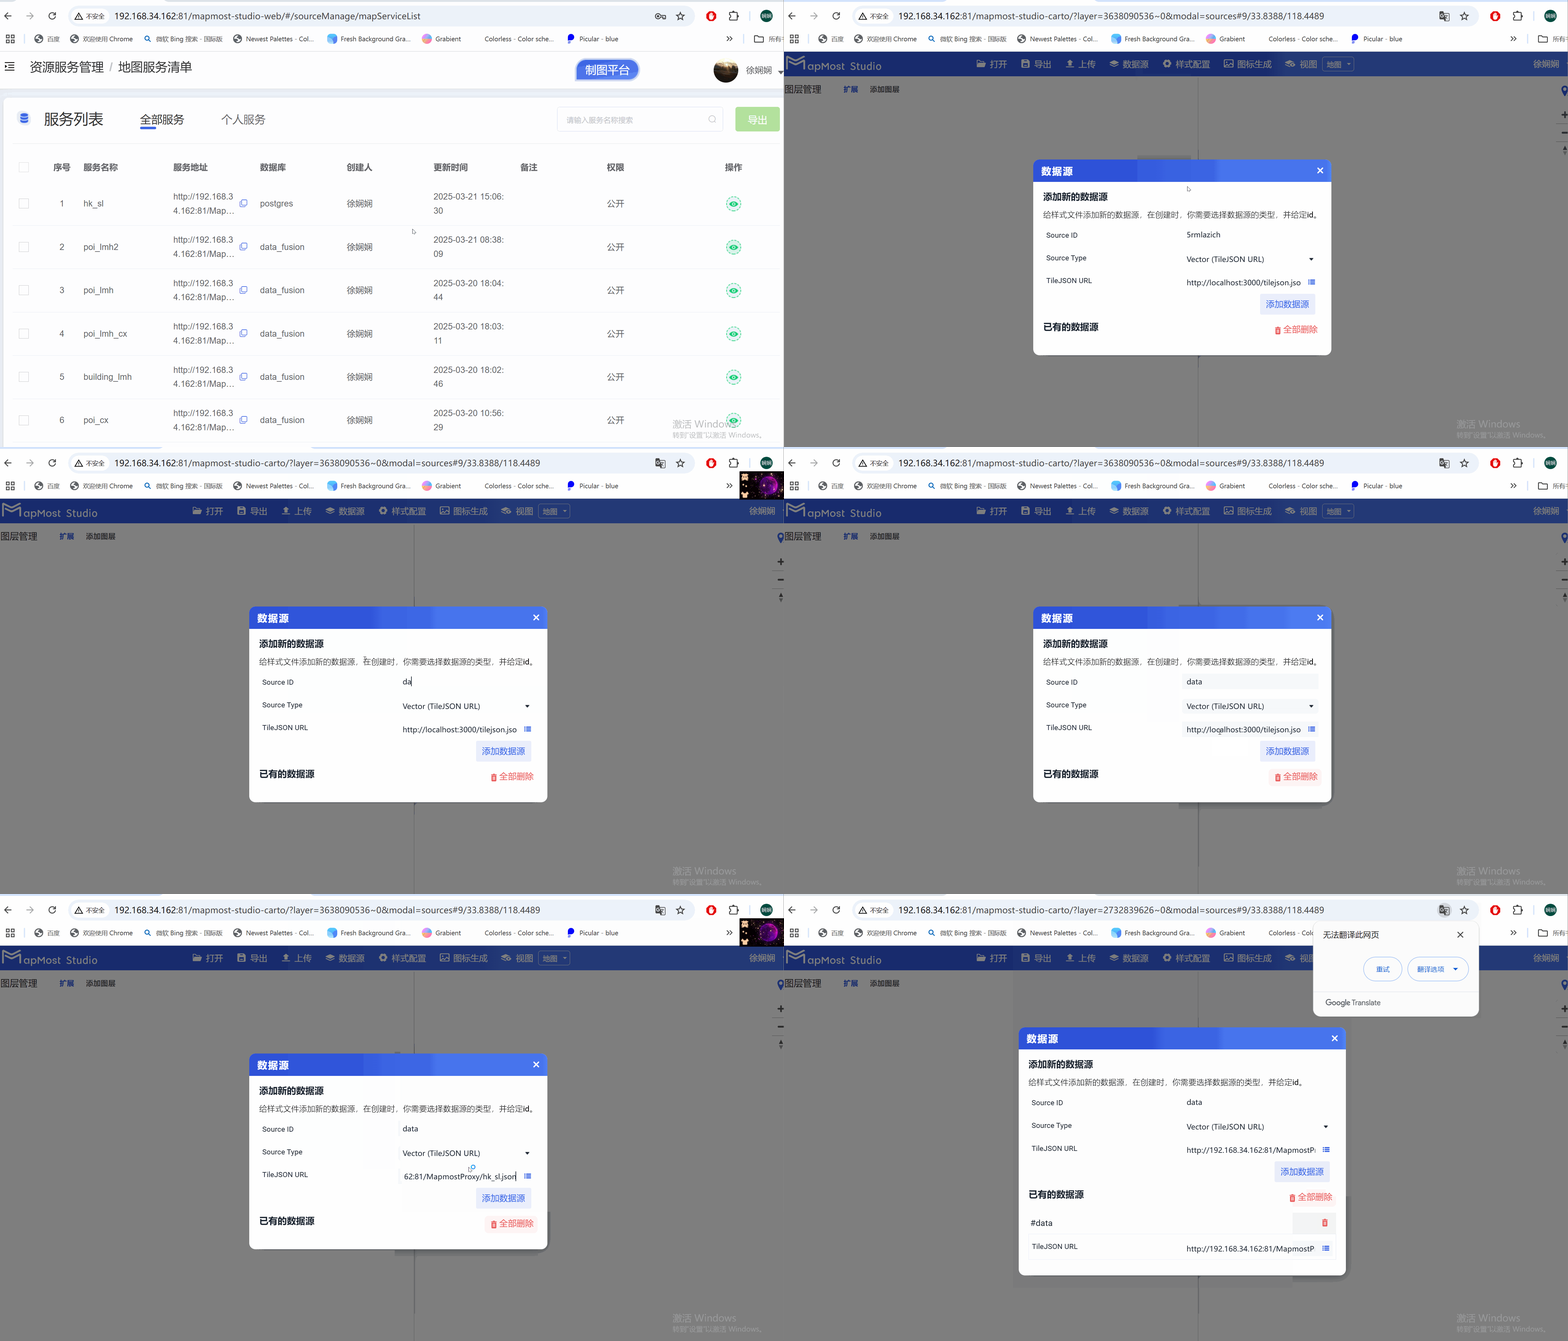
- Open the "Map Service List" in the menu bar and copy the fields in the "Service Address" column;

4.1.2. Configure data source pop-up window
- Click the "Mapping Platform" button to enter the mapping page, click the "Data Source" button to customize the ID, select the Type, and paste the service address of the URL;
4.2. Set center point coordinates
4.2.1. Configure the map center point
- Open Mapmost Studio, click the "Style Configuration" button and enter the center point coordinates. For details, refer to "Menu Bar: 5. Style Configuration";

4.3. Exporting styles and loading styles
4.3.1. Map standard naming
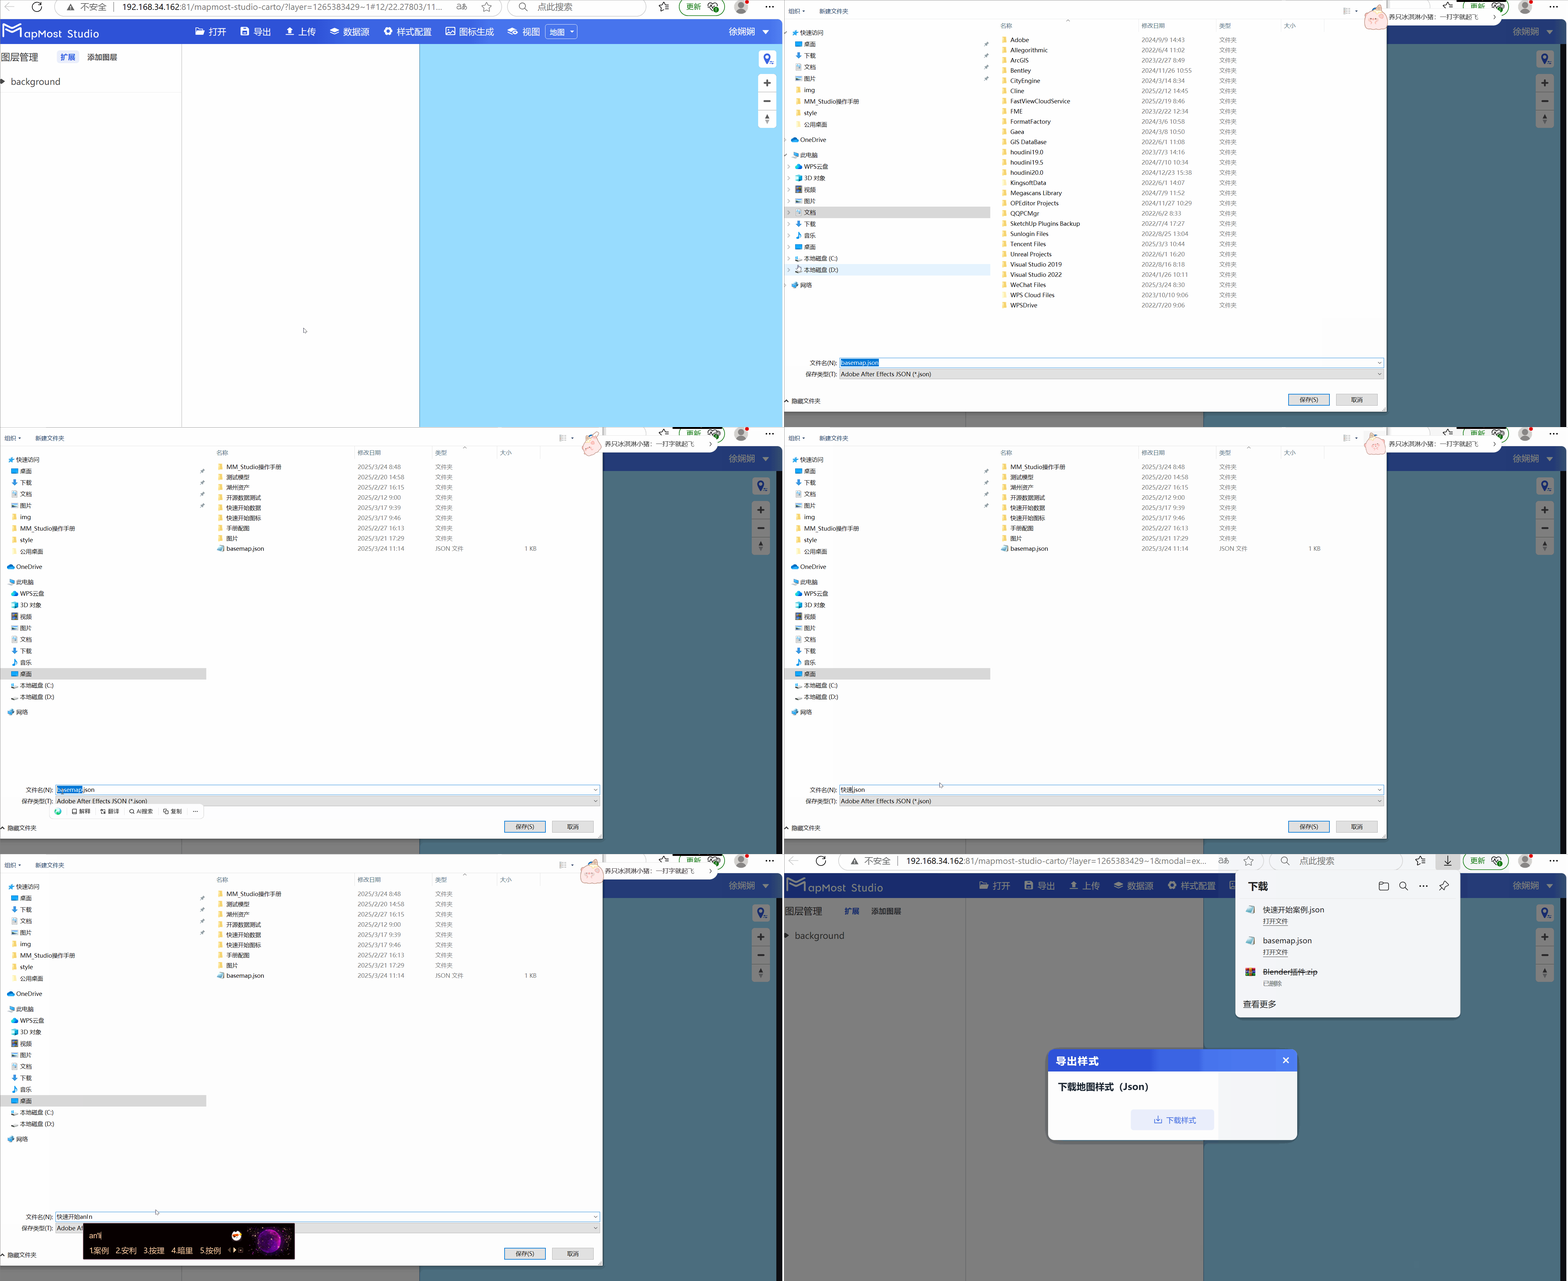
- Click the "Export" button to export the existing style and standardize the naming;
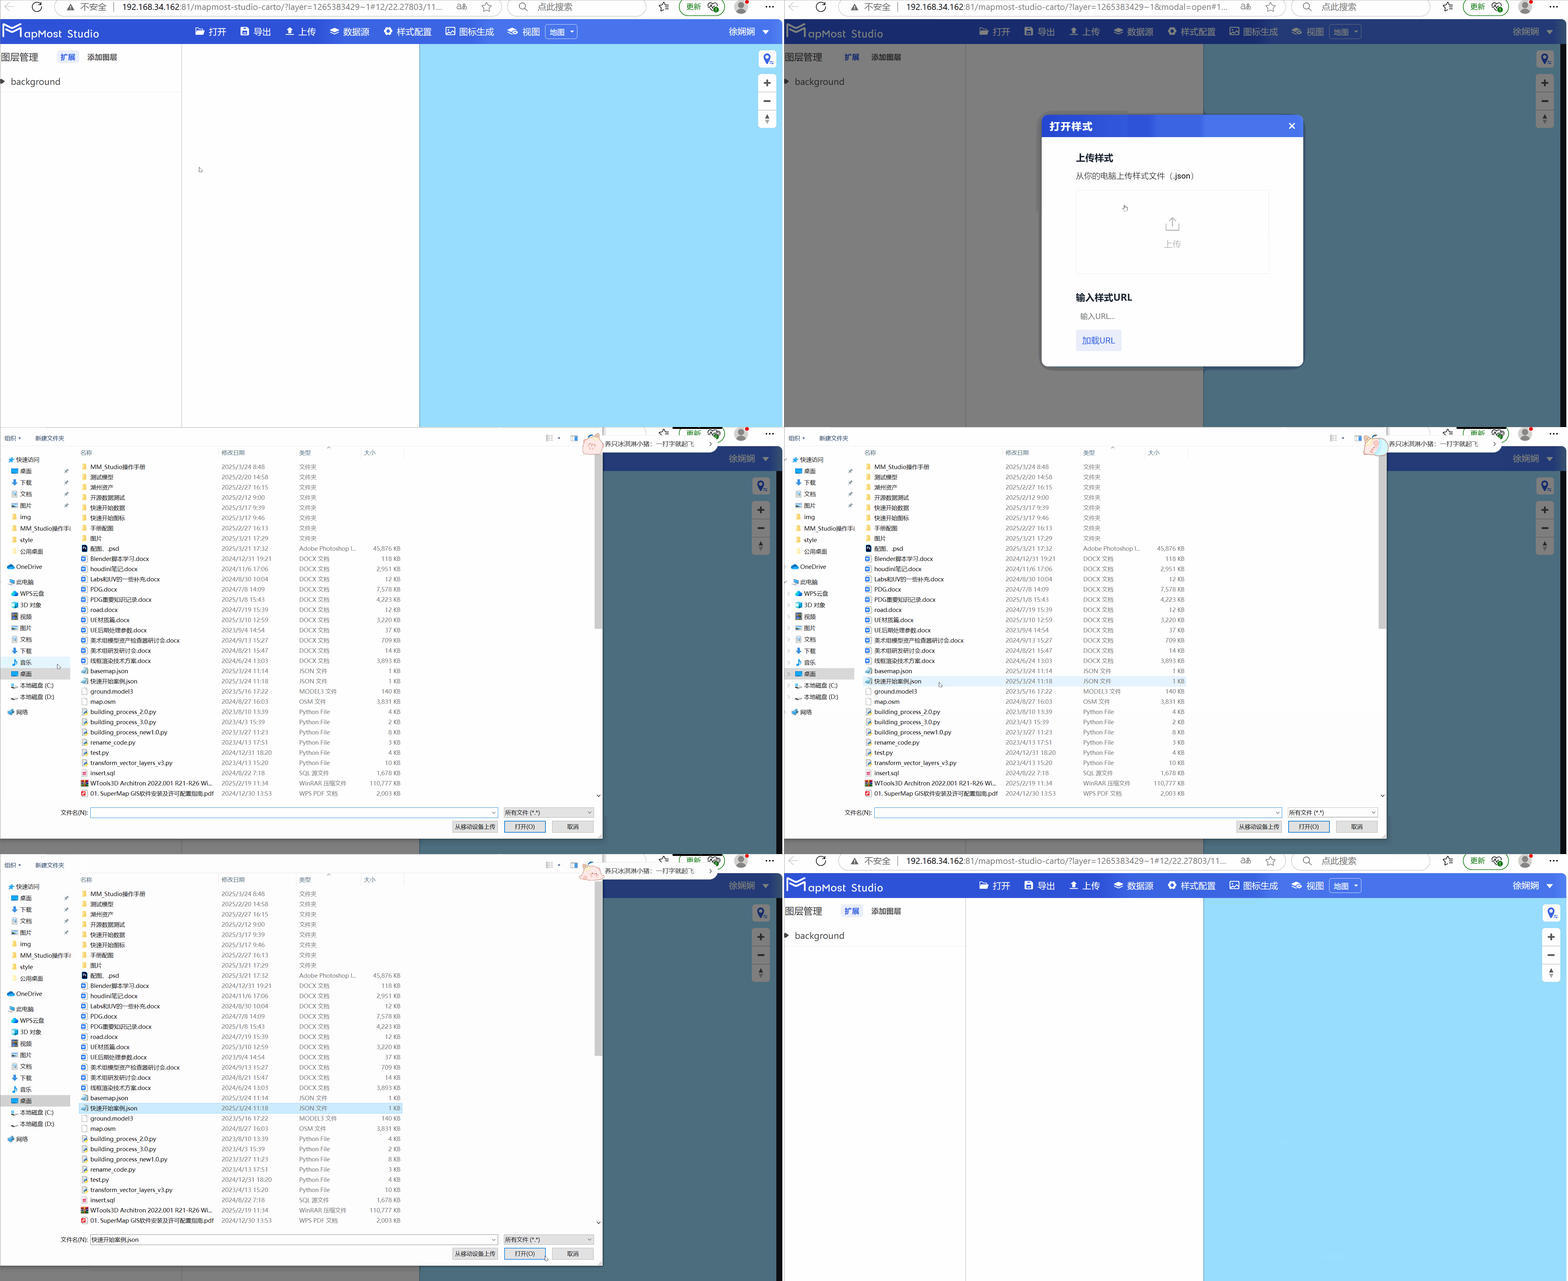
4.3.2. Load Json file
- Click the "Open" button to load the Json file in Mapmost Studio;
5. Cartography
- Obtain the service and configure the map and basic parameters;
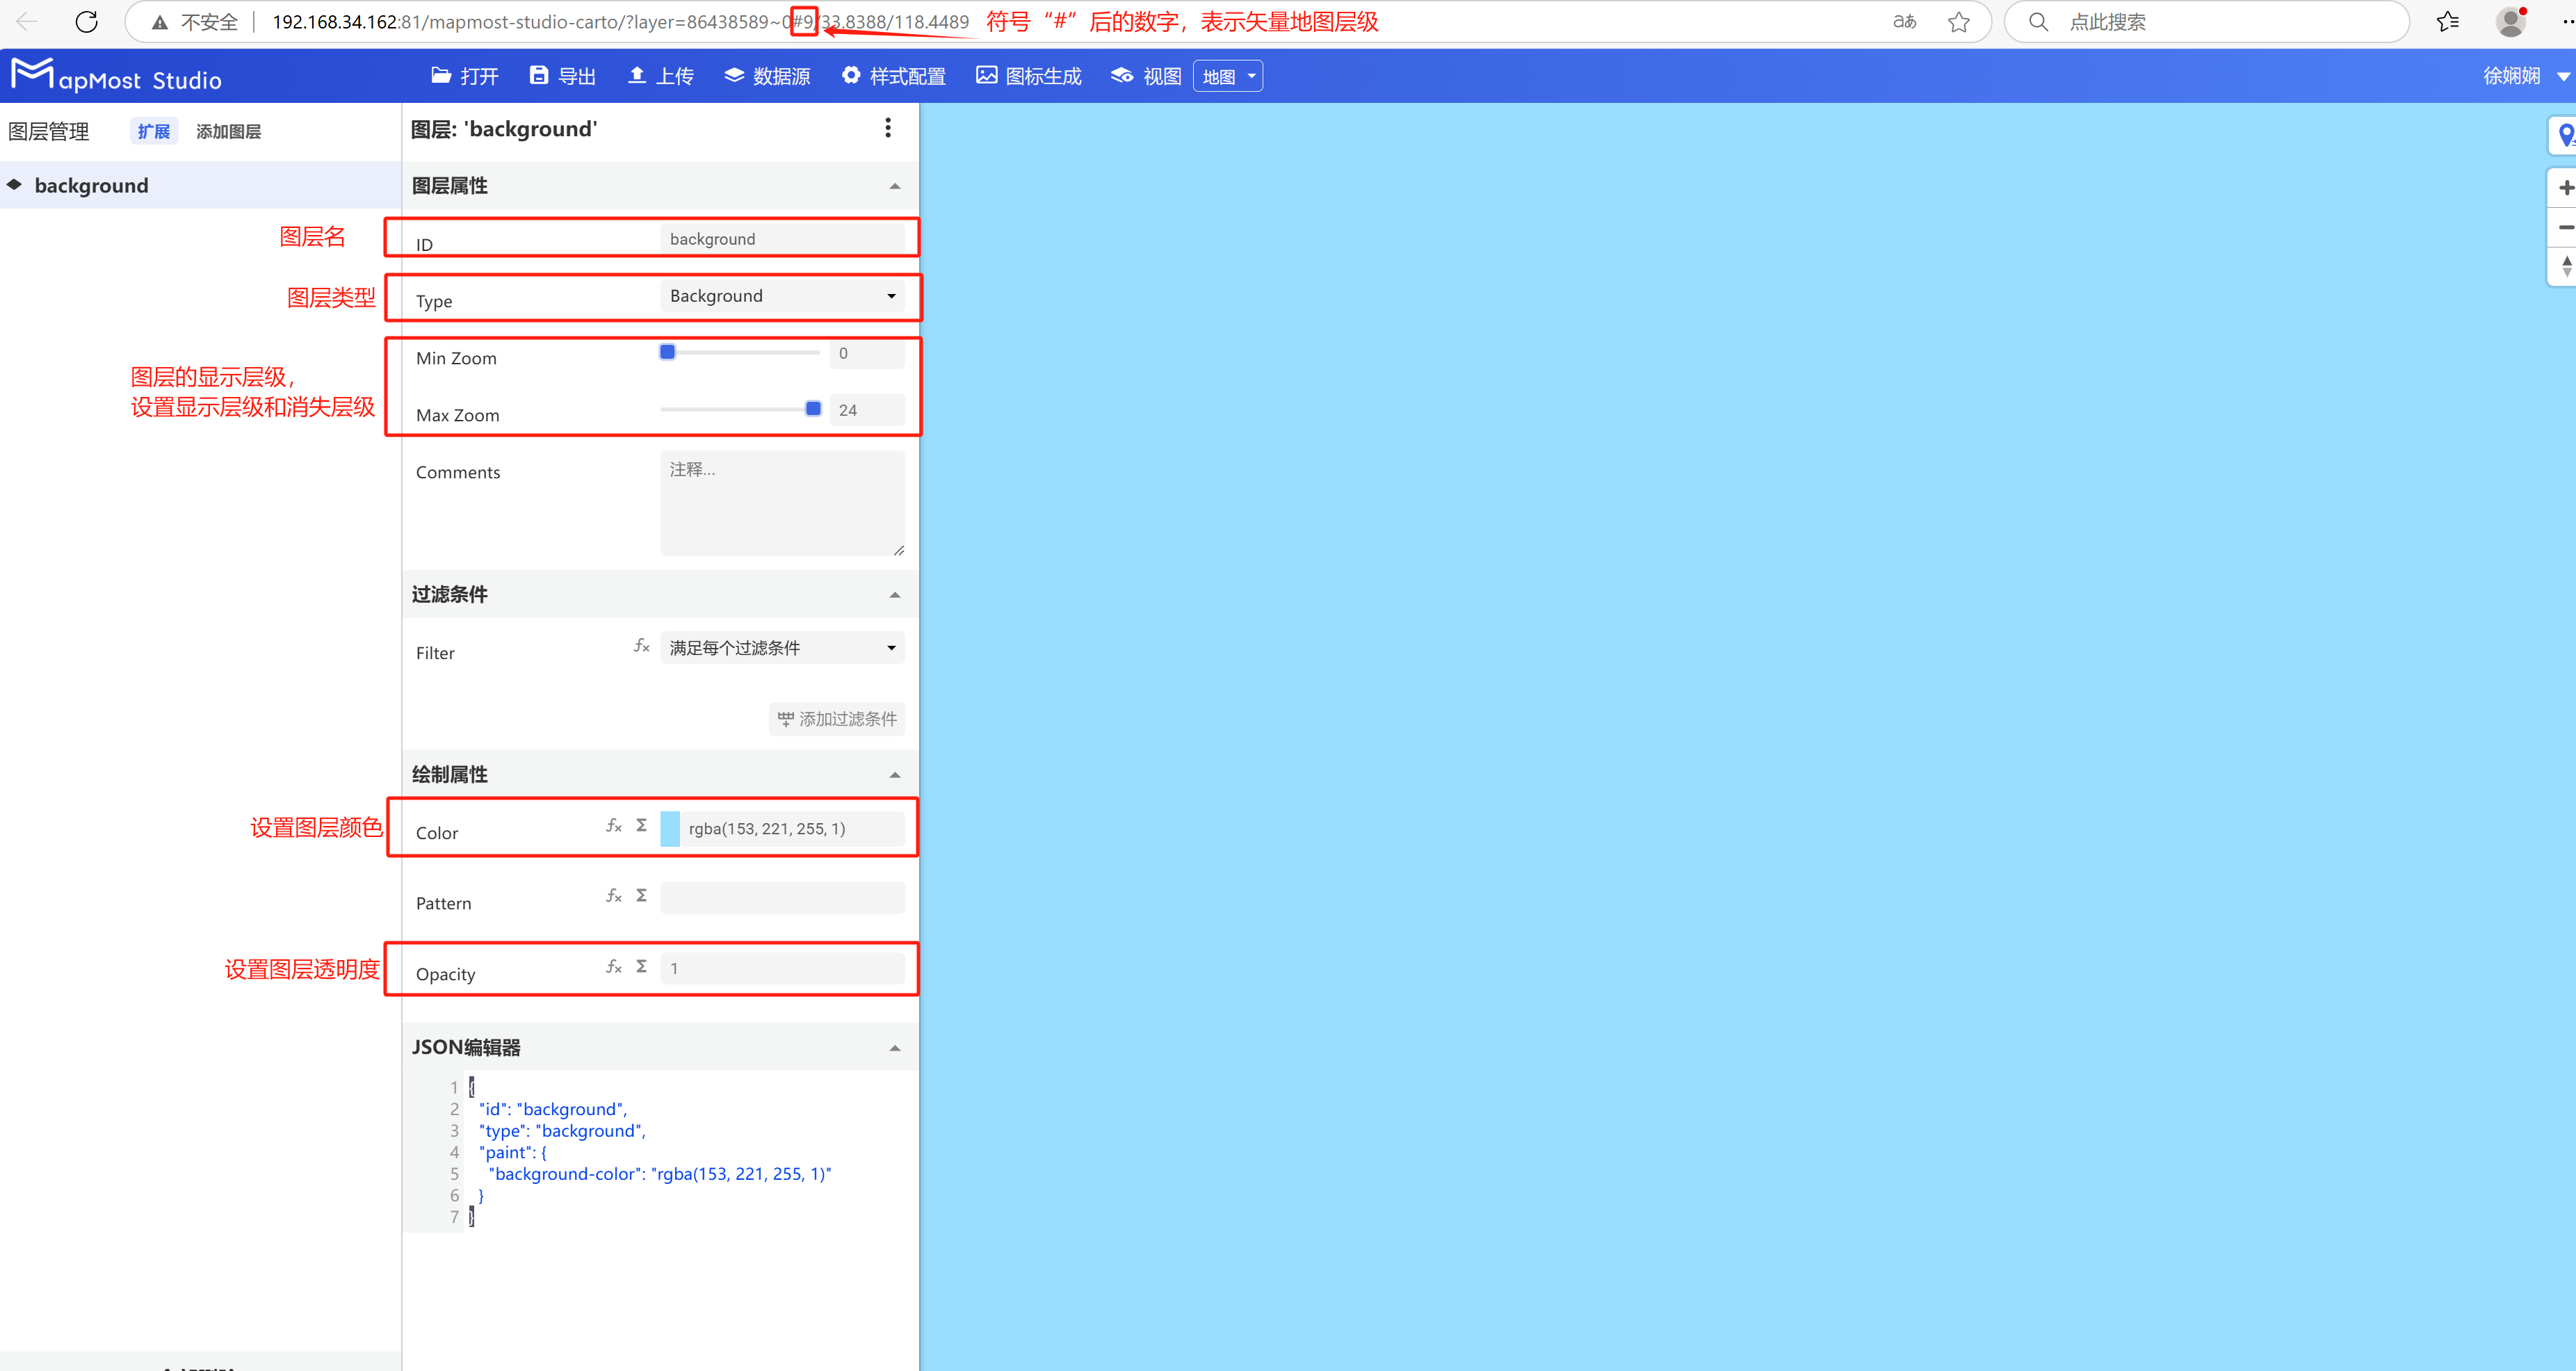
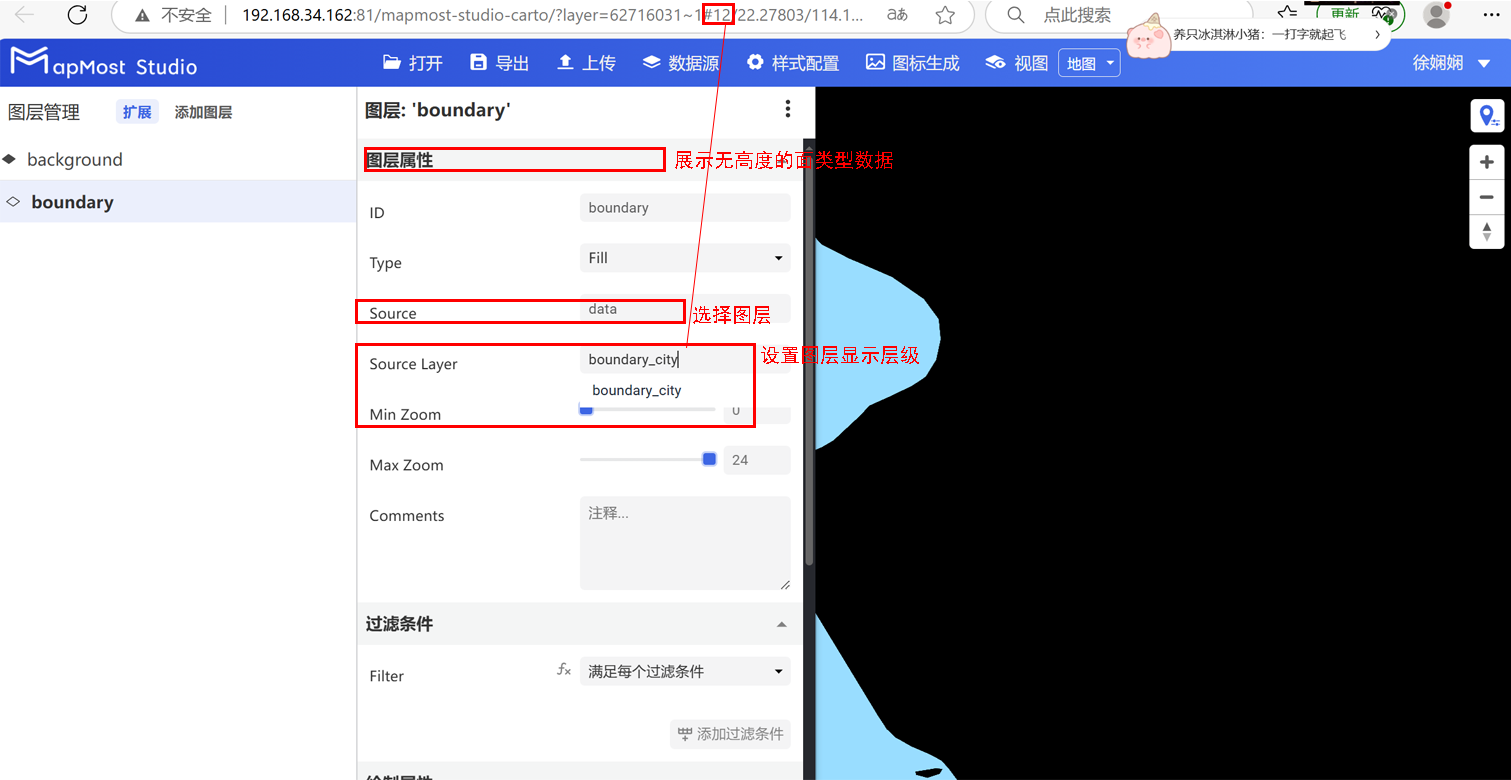
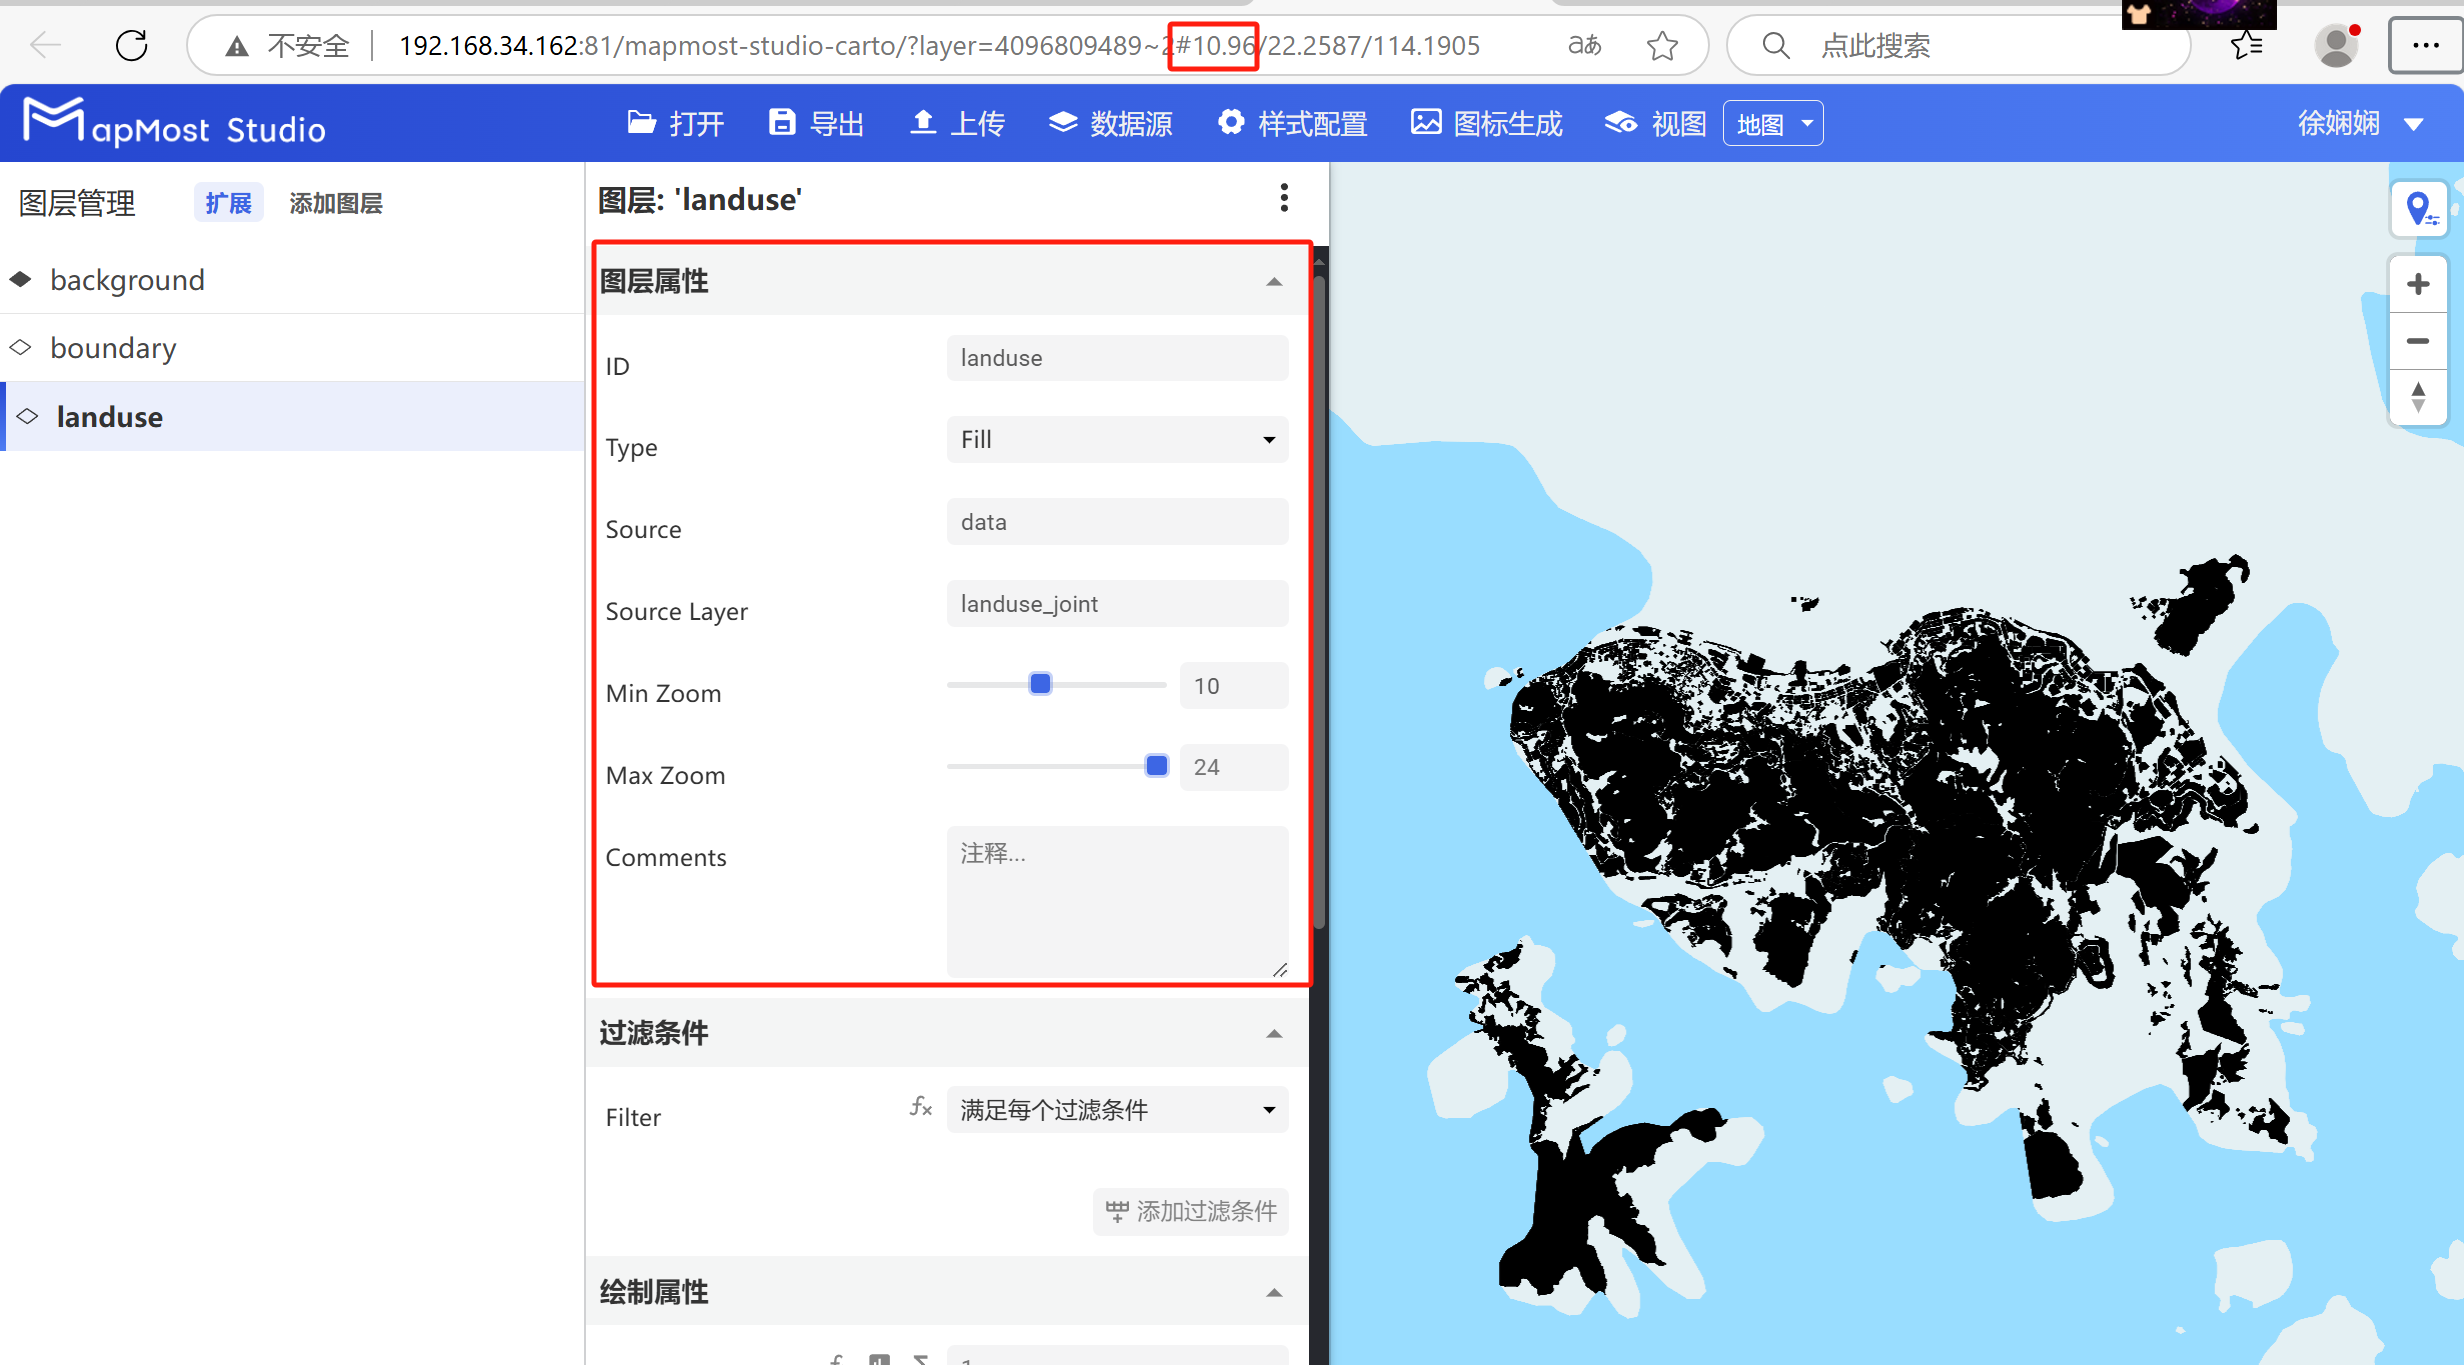
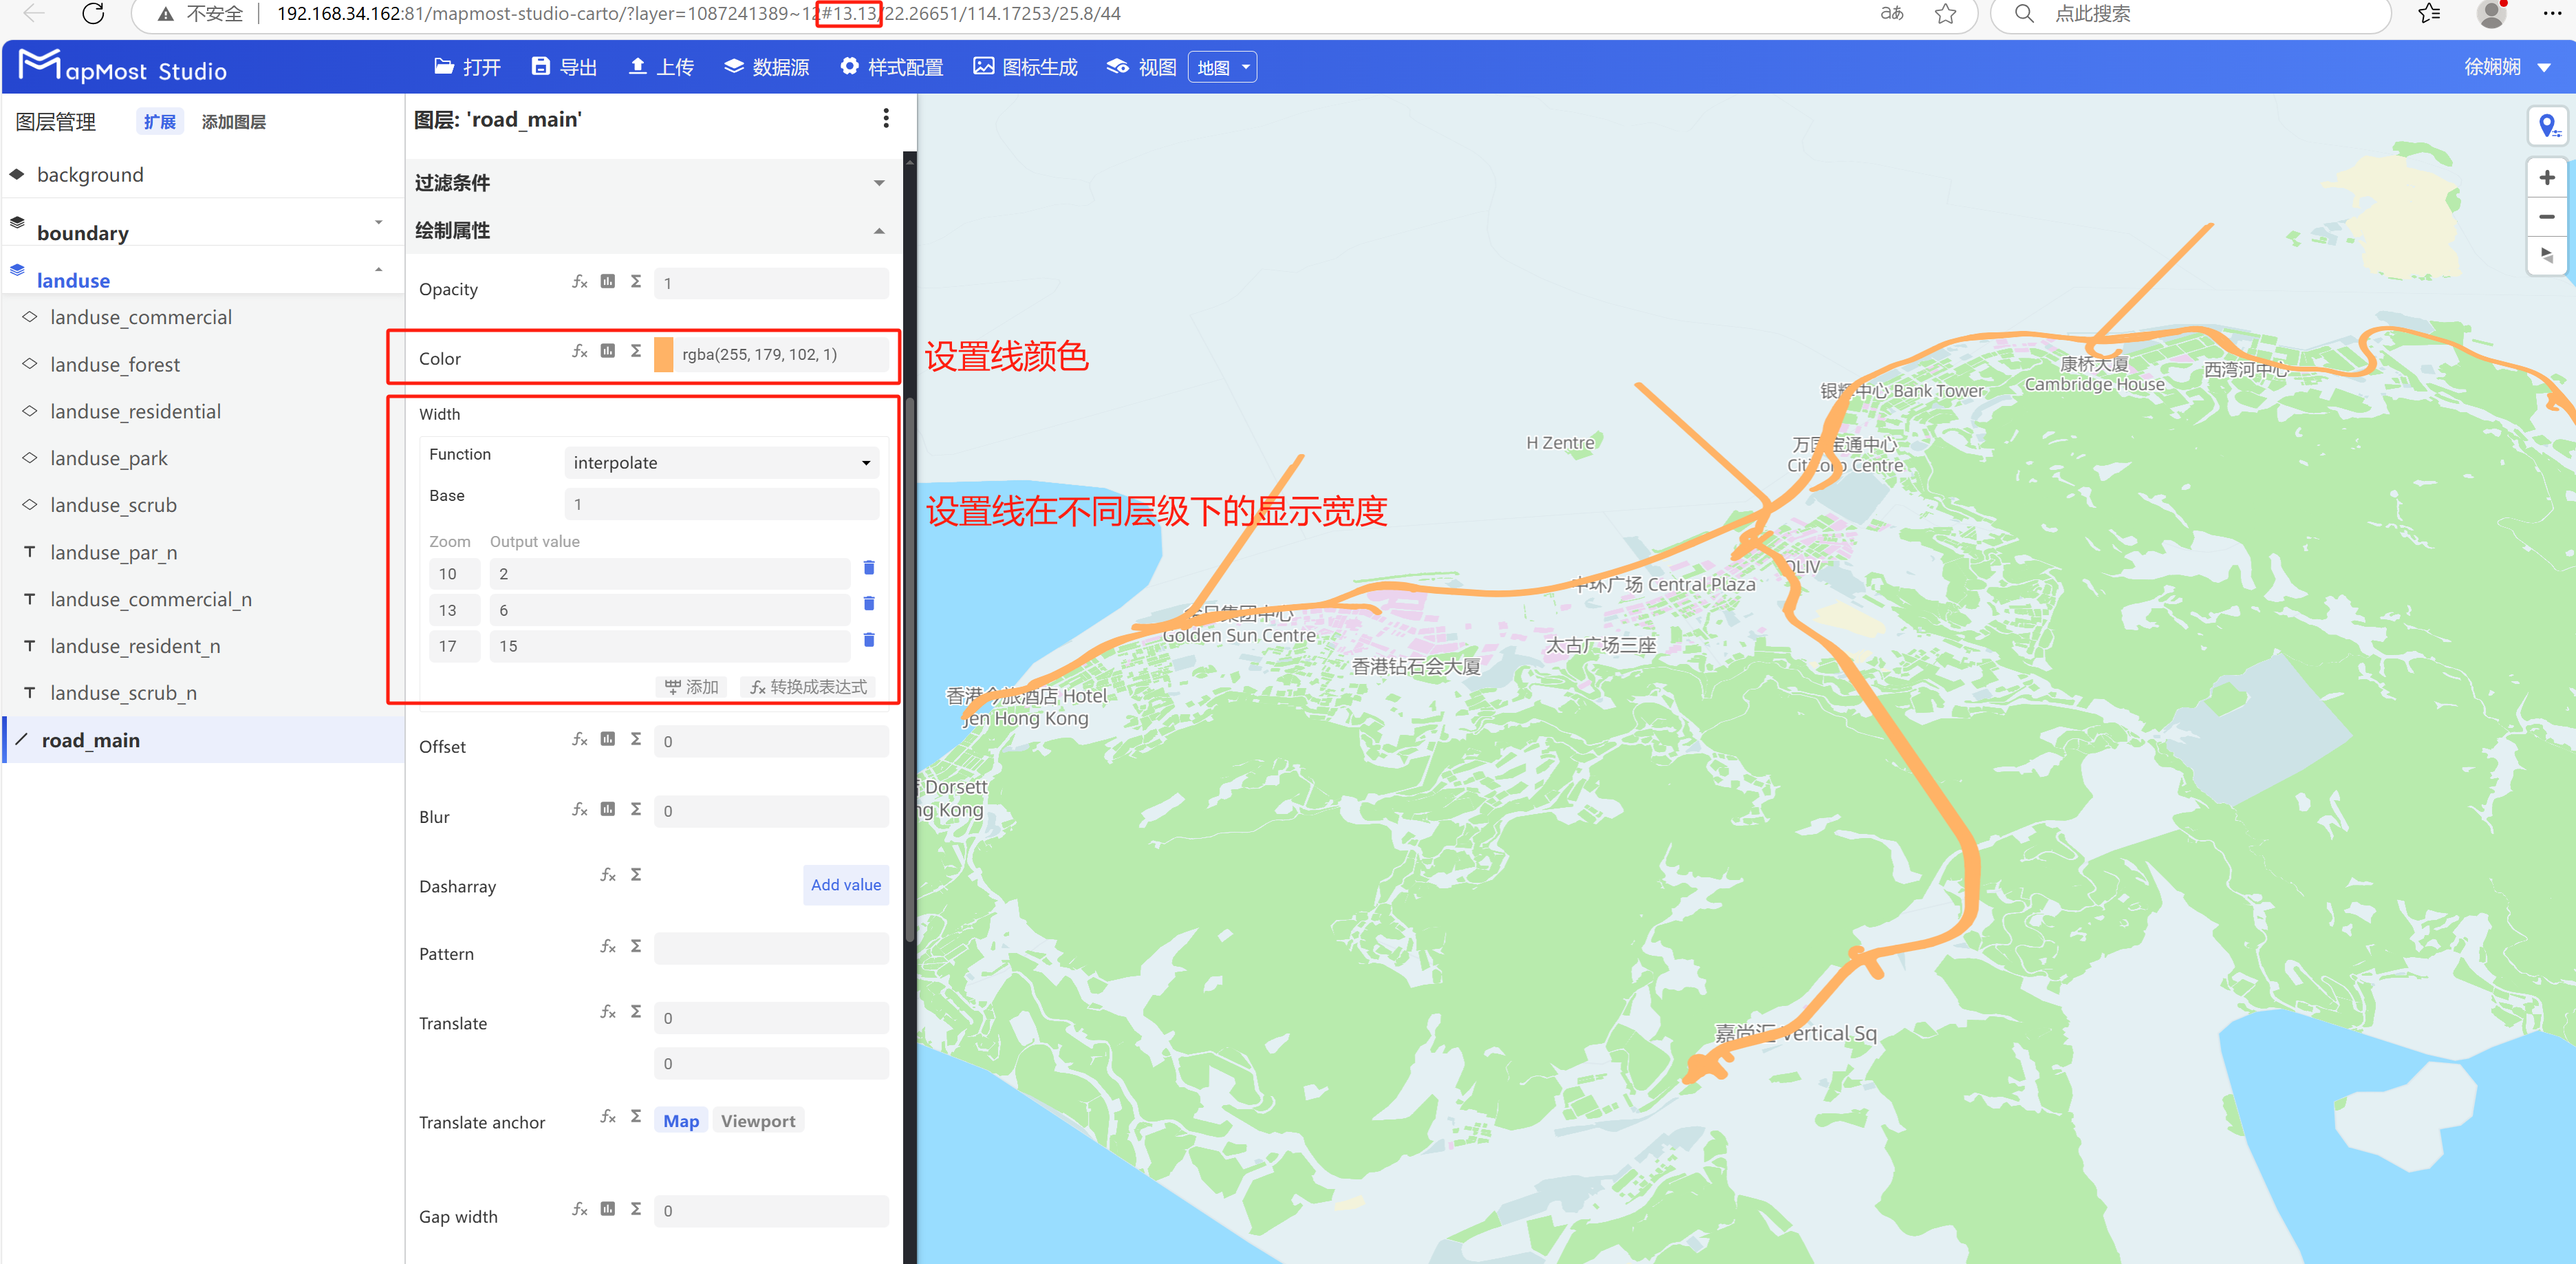
- The number after "#" in the URL is the display level of the current view;
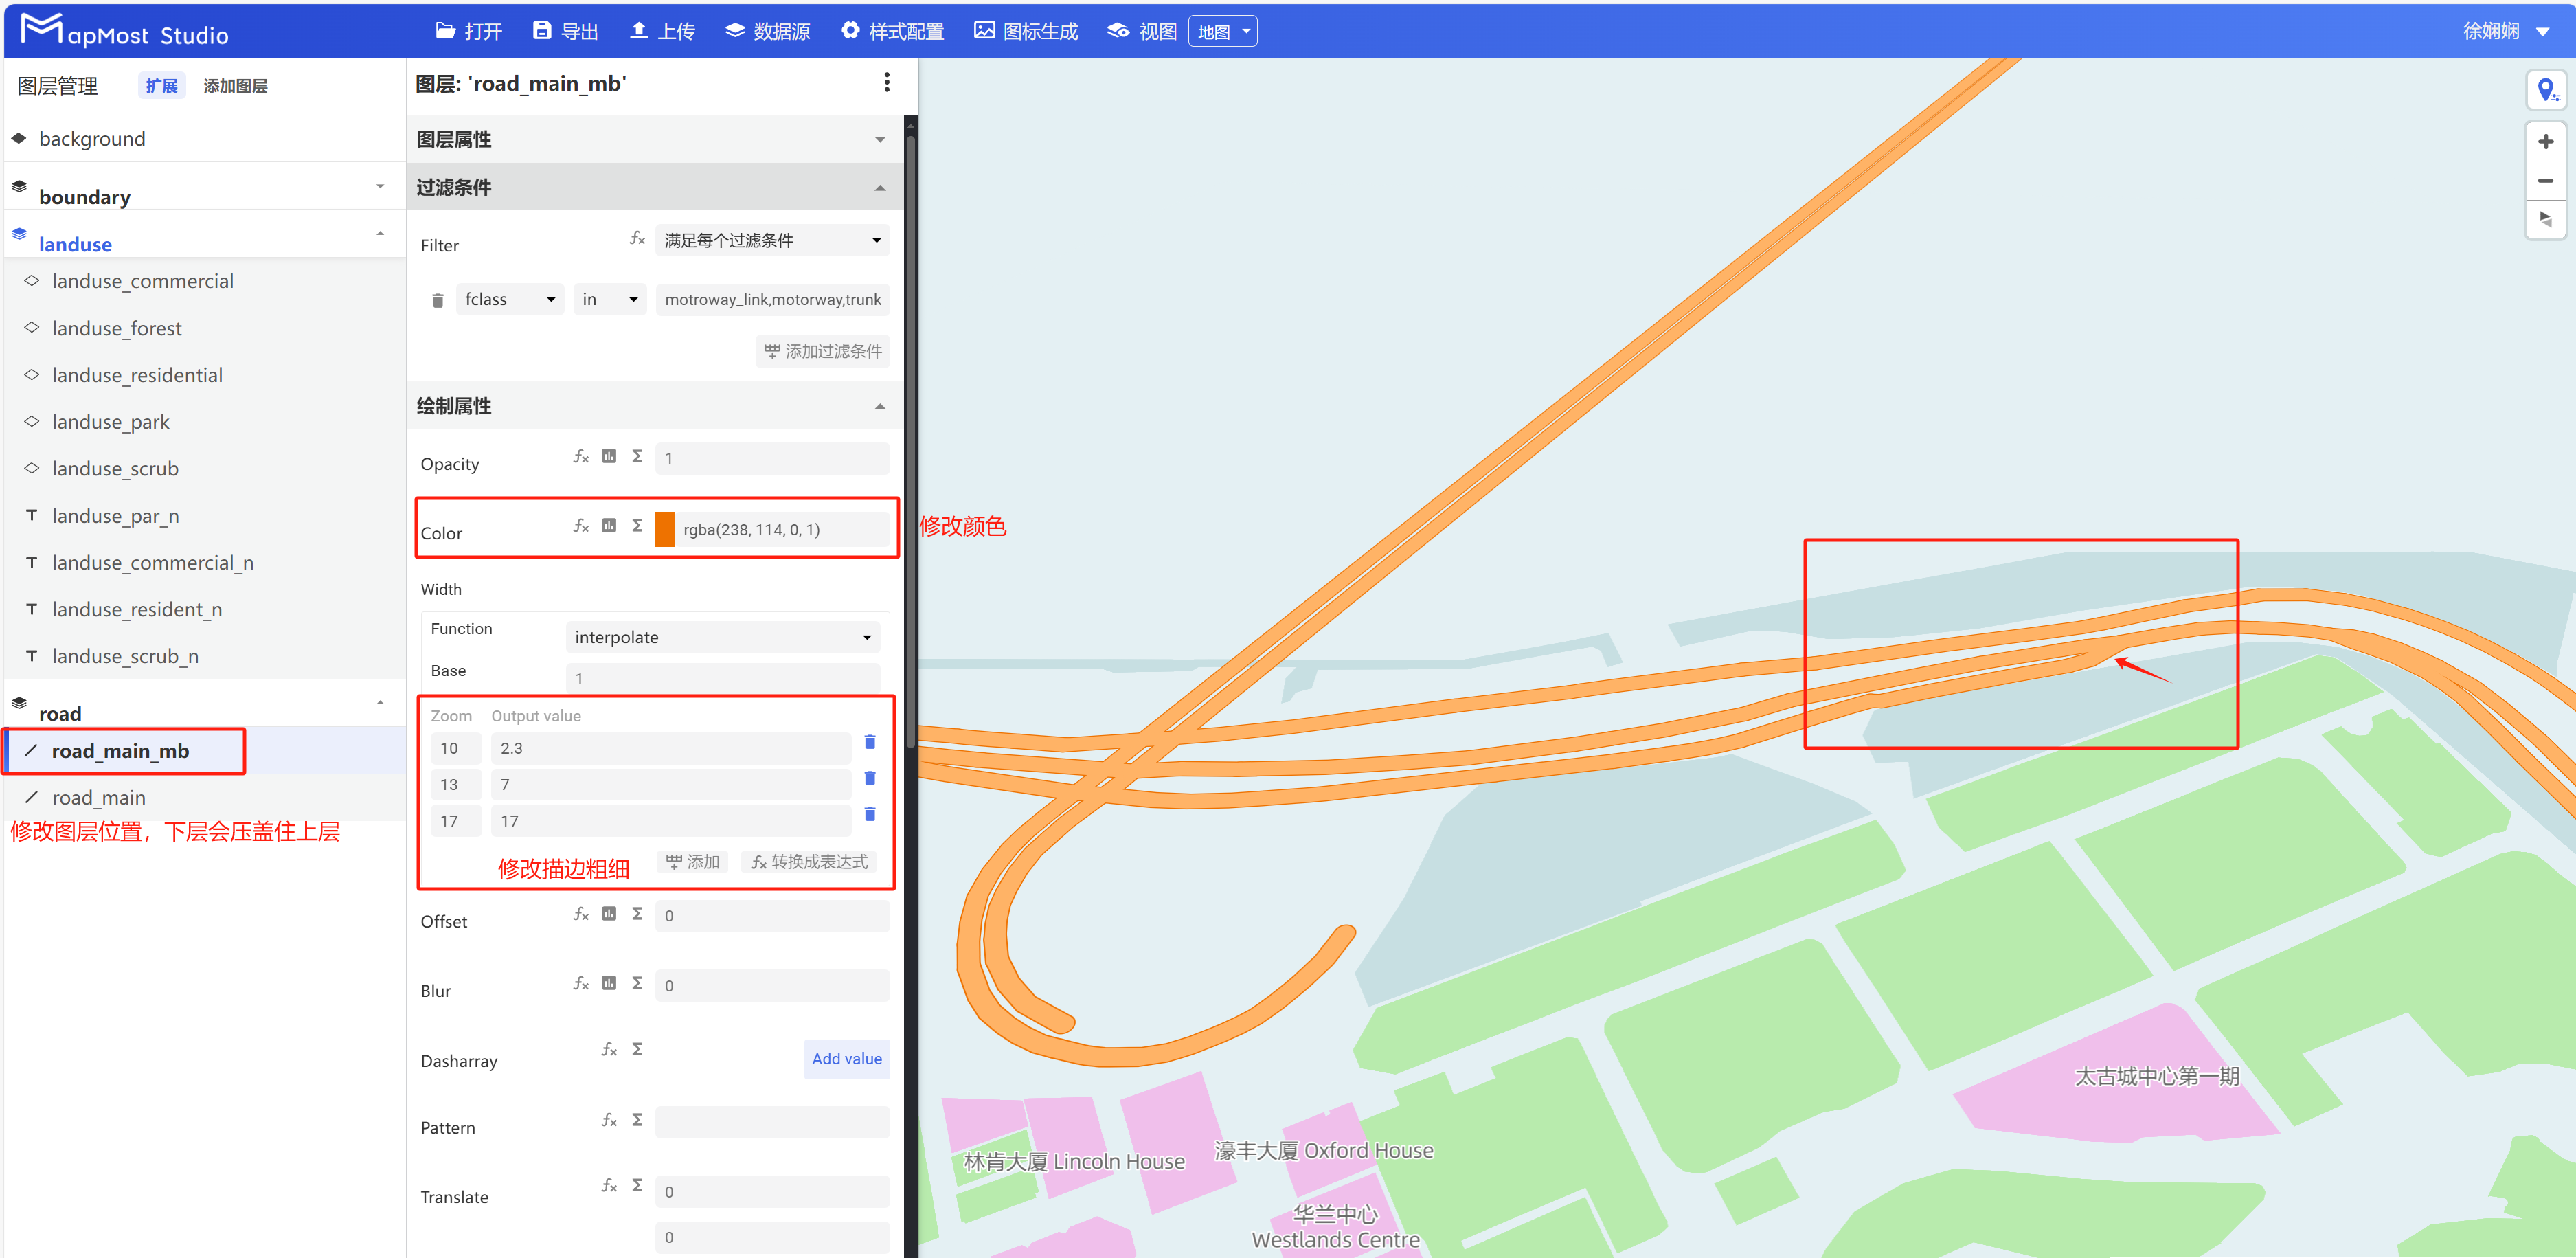
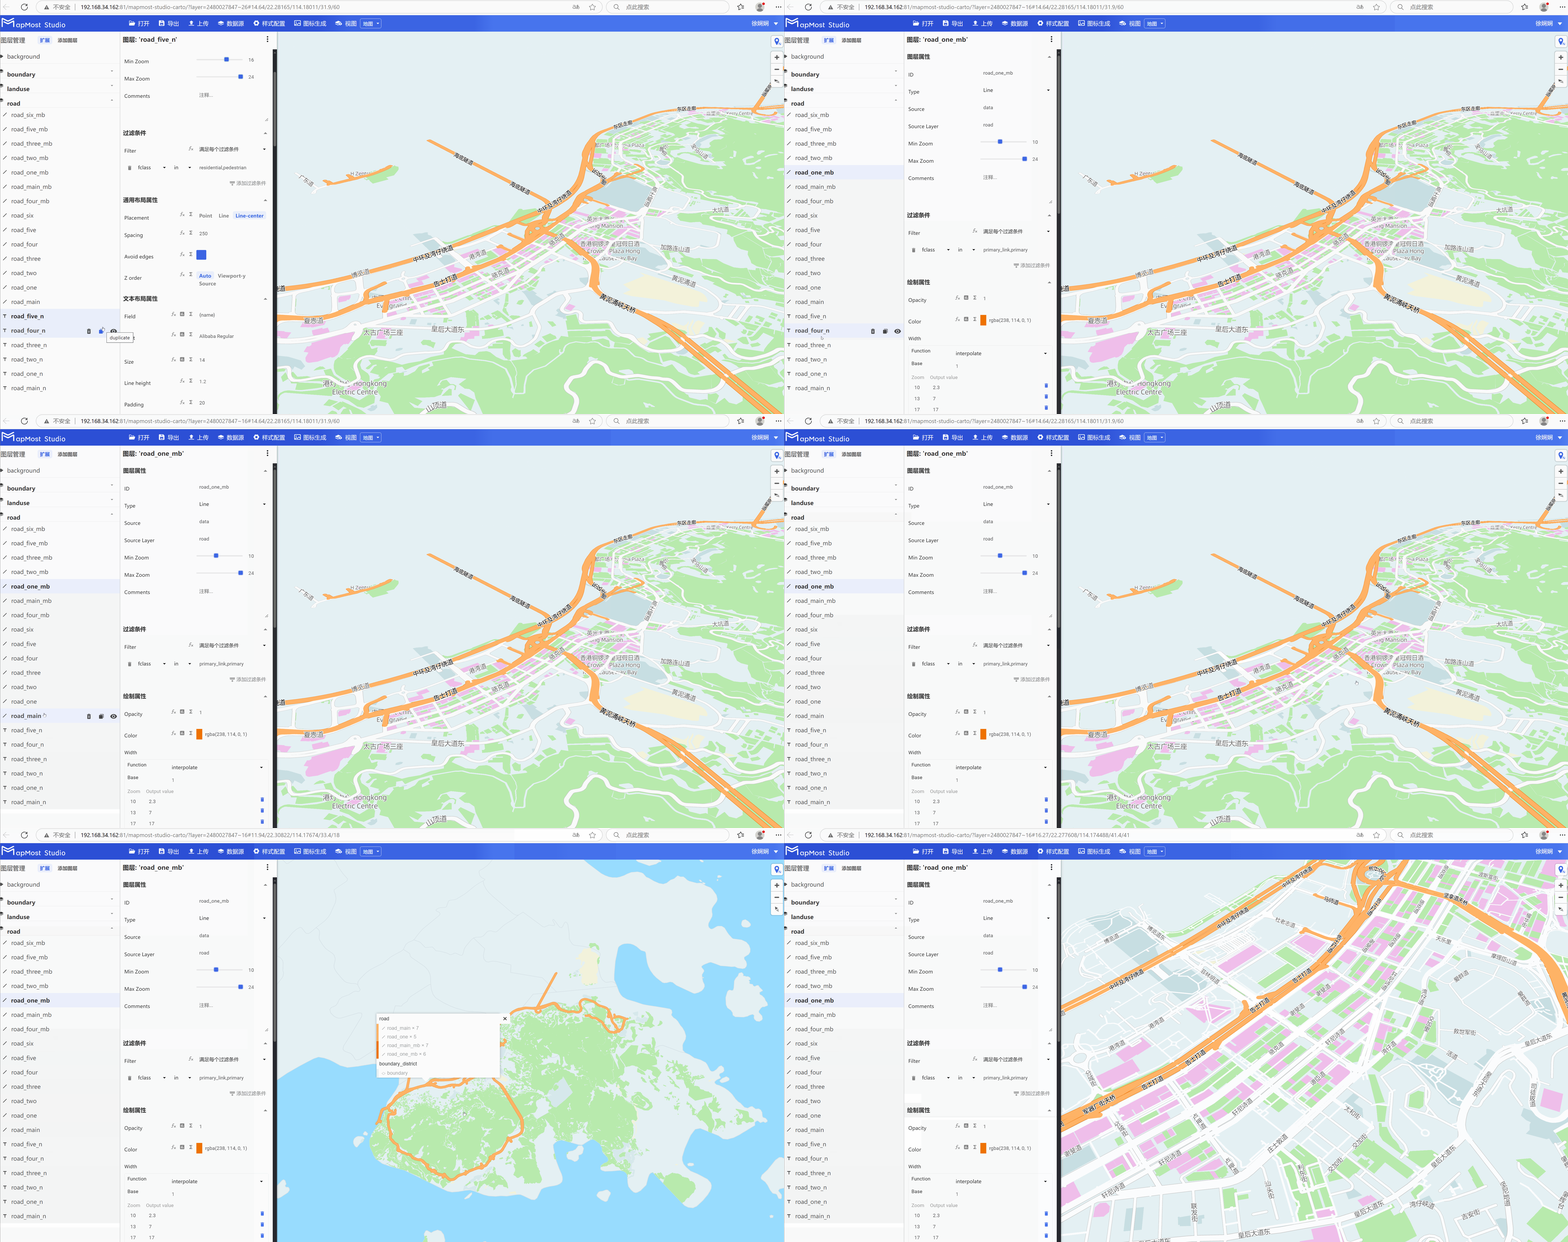
- Lower-level layers will form a capping effect on upper-level layers, so you need to pay attention to adjusting the layer order;
- When the layer name prefixes are consistent, the layers will be automatically grouped;
5.1. Add background layer
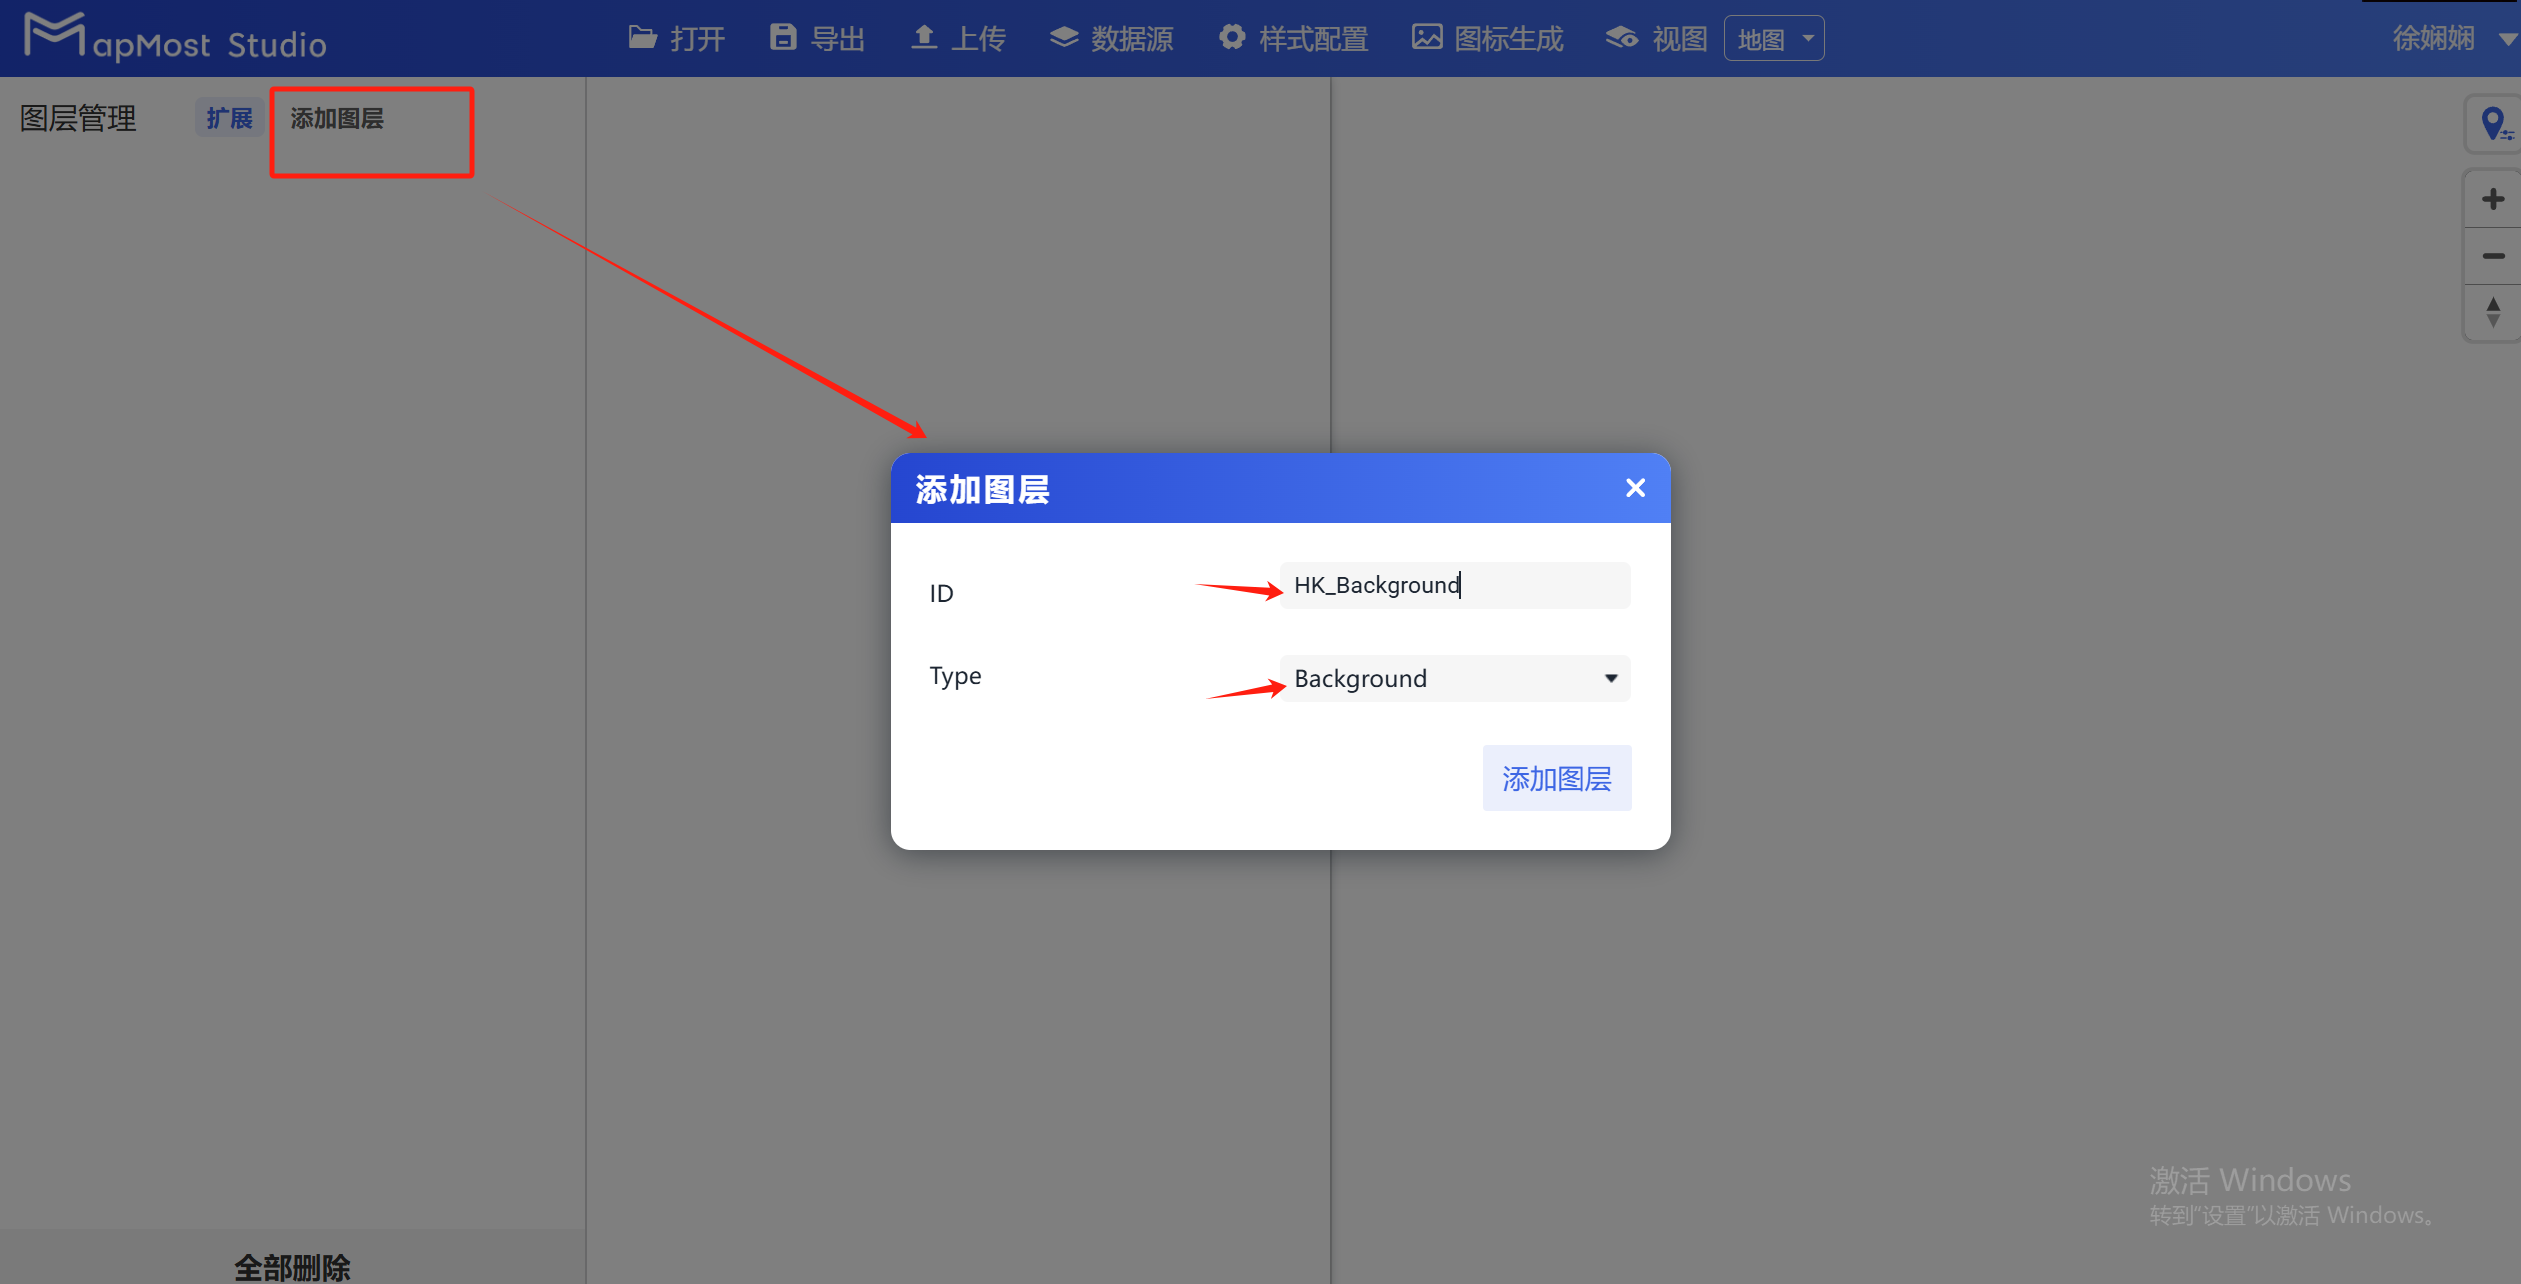
5.1.1. Configure the "Add Layer" pop-up window
Click the "Add Layer" button to add a background layer, customize the "ID" to "Background", and select "Type" to "Background";
5.1.2. Configure the "Layer Properties" module
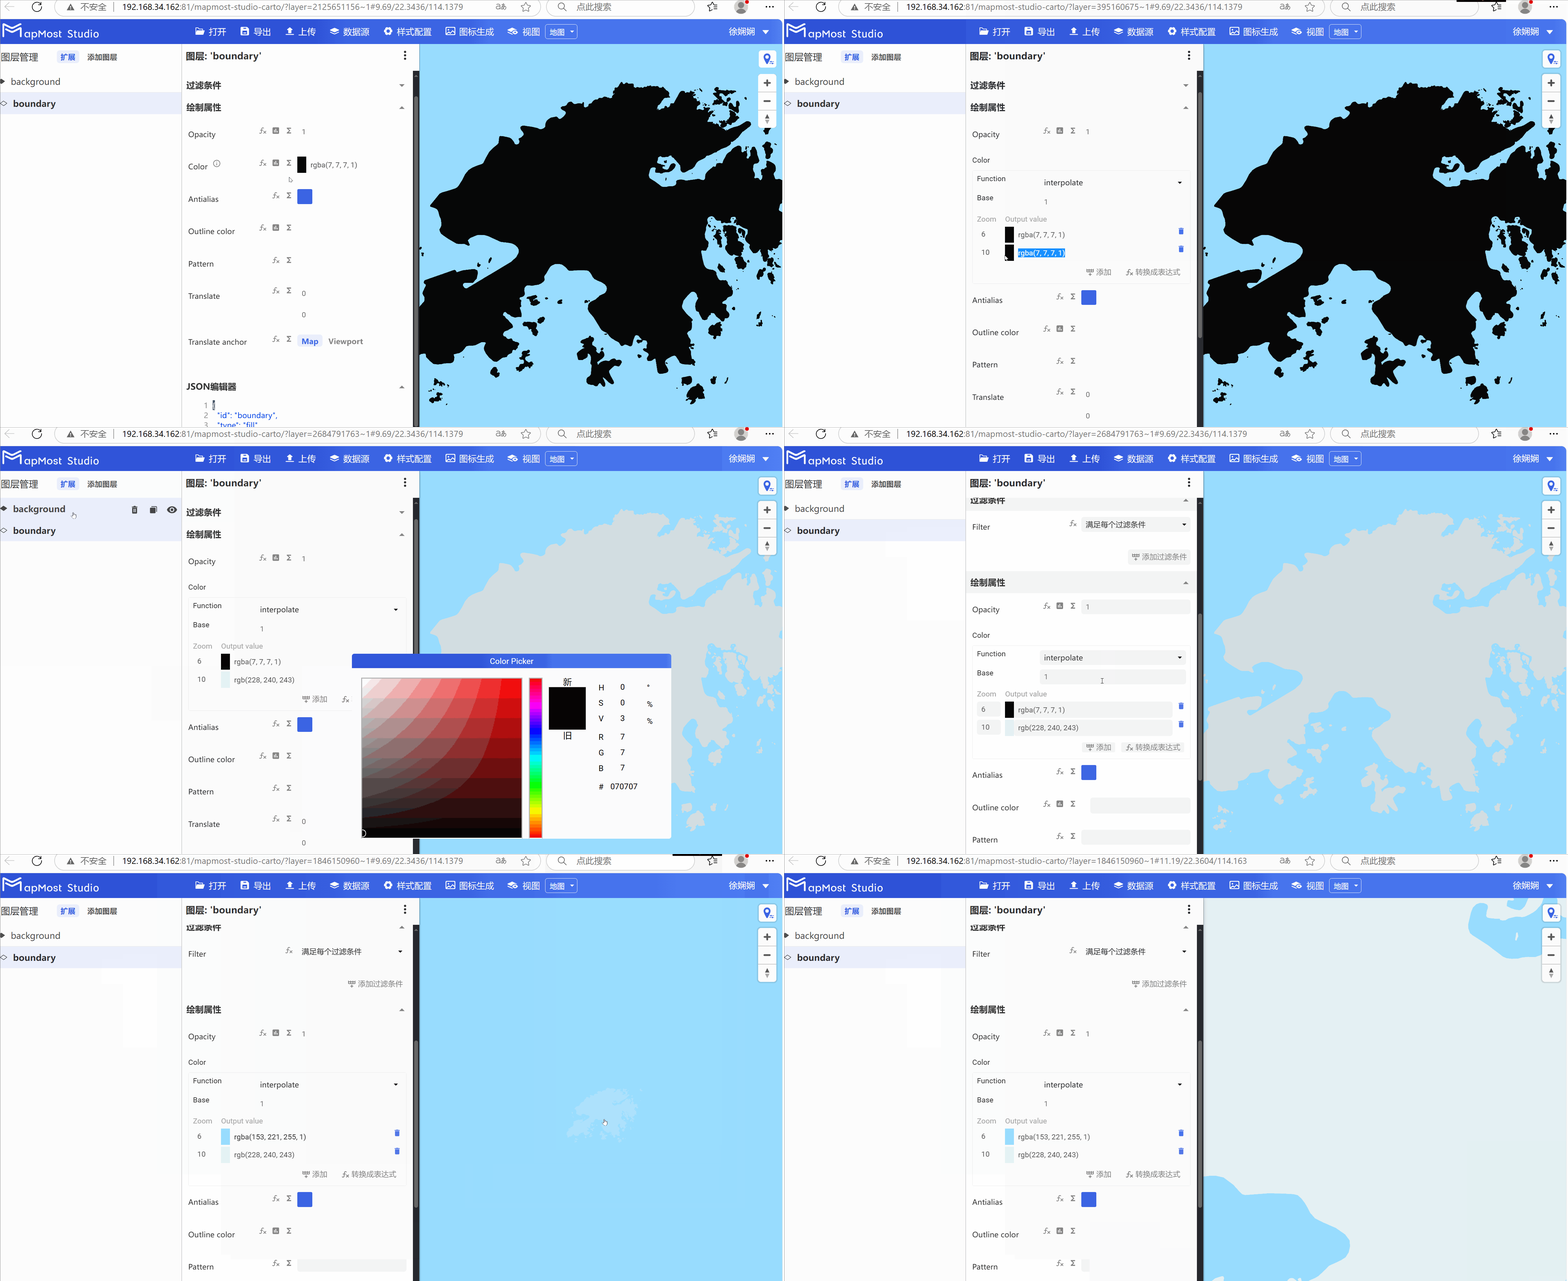
Select the "Background" layer, configure the "Drawing Properties" module parameters, and modify the background layer color and transparency ("#9" in the web link indicates that the current window level is at level 9);
5.2. Add boundary layer and set layer properties
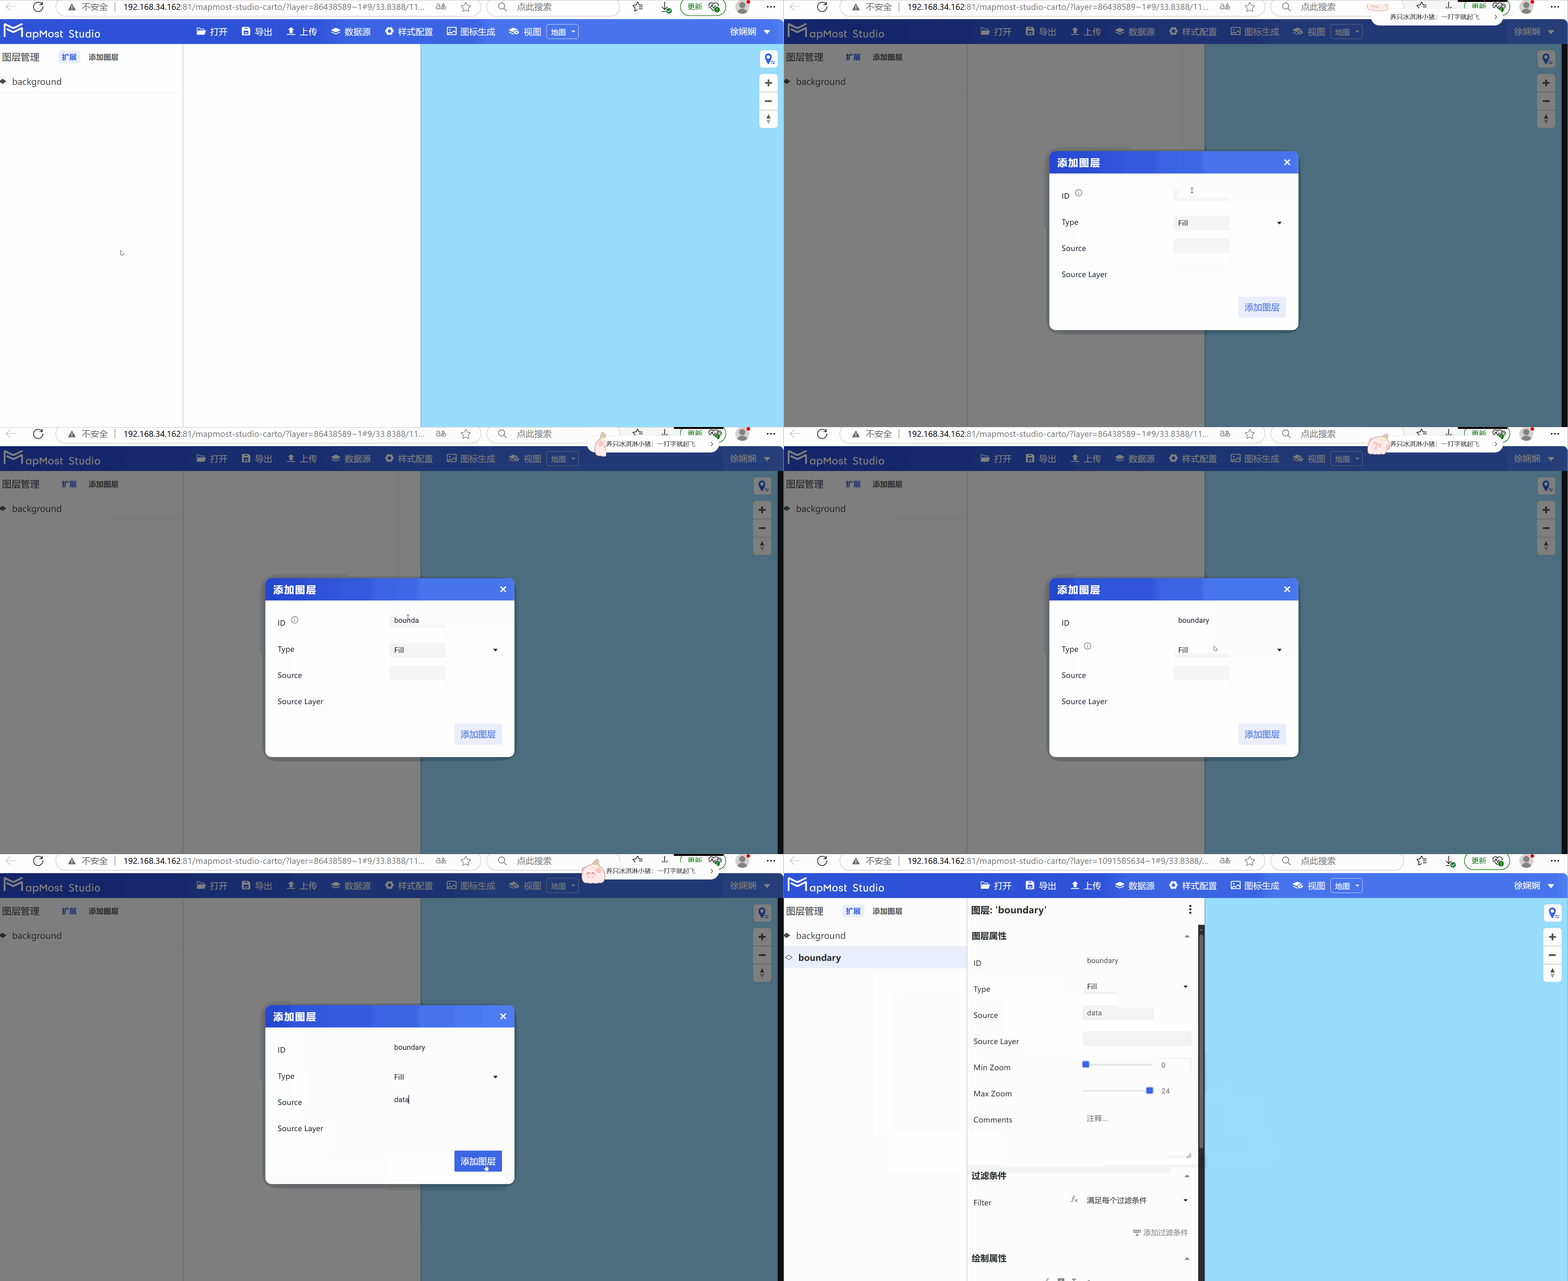
5.2.1. Configure the "Add Layer" pop-up window
- Click the "Add Layer" button to add a boundary layer, customize the "ID" to "boundary", select "Fill" for "Type", and select "data" for "Source"; for "Type" details, refer to "Background layer Background:1.2"; for "Source" the parameter is the ID parameter in "Data Source", for details refer to "Cartography Prerequisite: 2.1";
5.2.2. Configure the "Layer Properties" module
- Select the "boundary" layer, configure the "Layer Properties" module parameters, and select "Source Layer" as "boundary_district", where "Source Layer" is consistent with the "layer name" field set in the publishing service.
5.2.3. Configure the "Drawing Properties" module
- Select the "boundary" layer and configure the "Drawing Attributes" module parameters. Click "Σ" to control the display effect of attributes at different levels. Click the "!" after each parameter to view parameter comments;
5.2.4. Copy the "Layer Properties" module
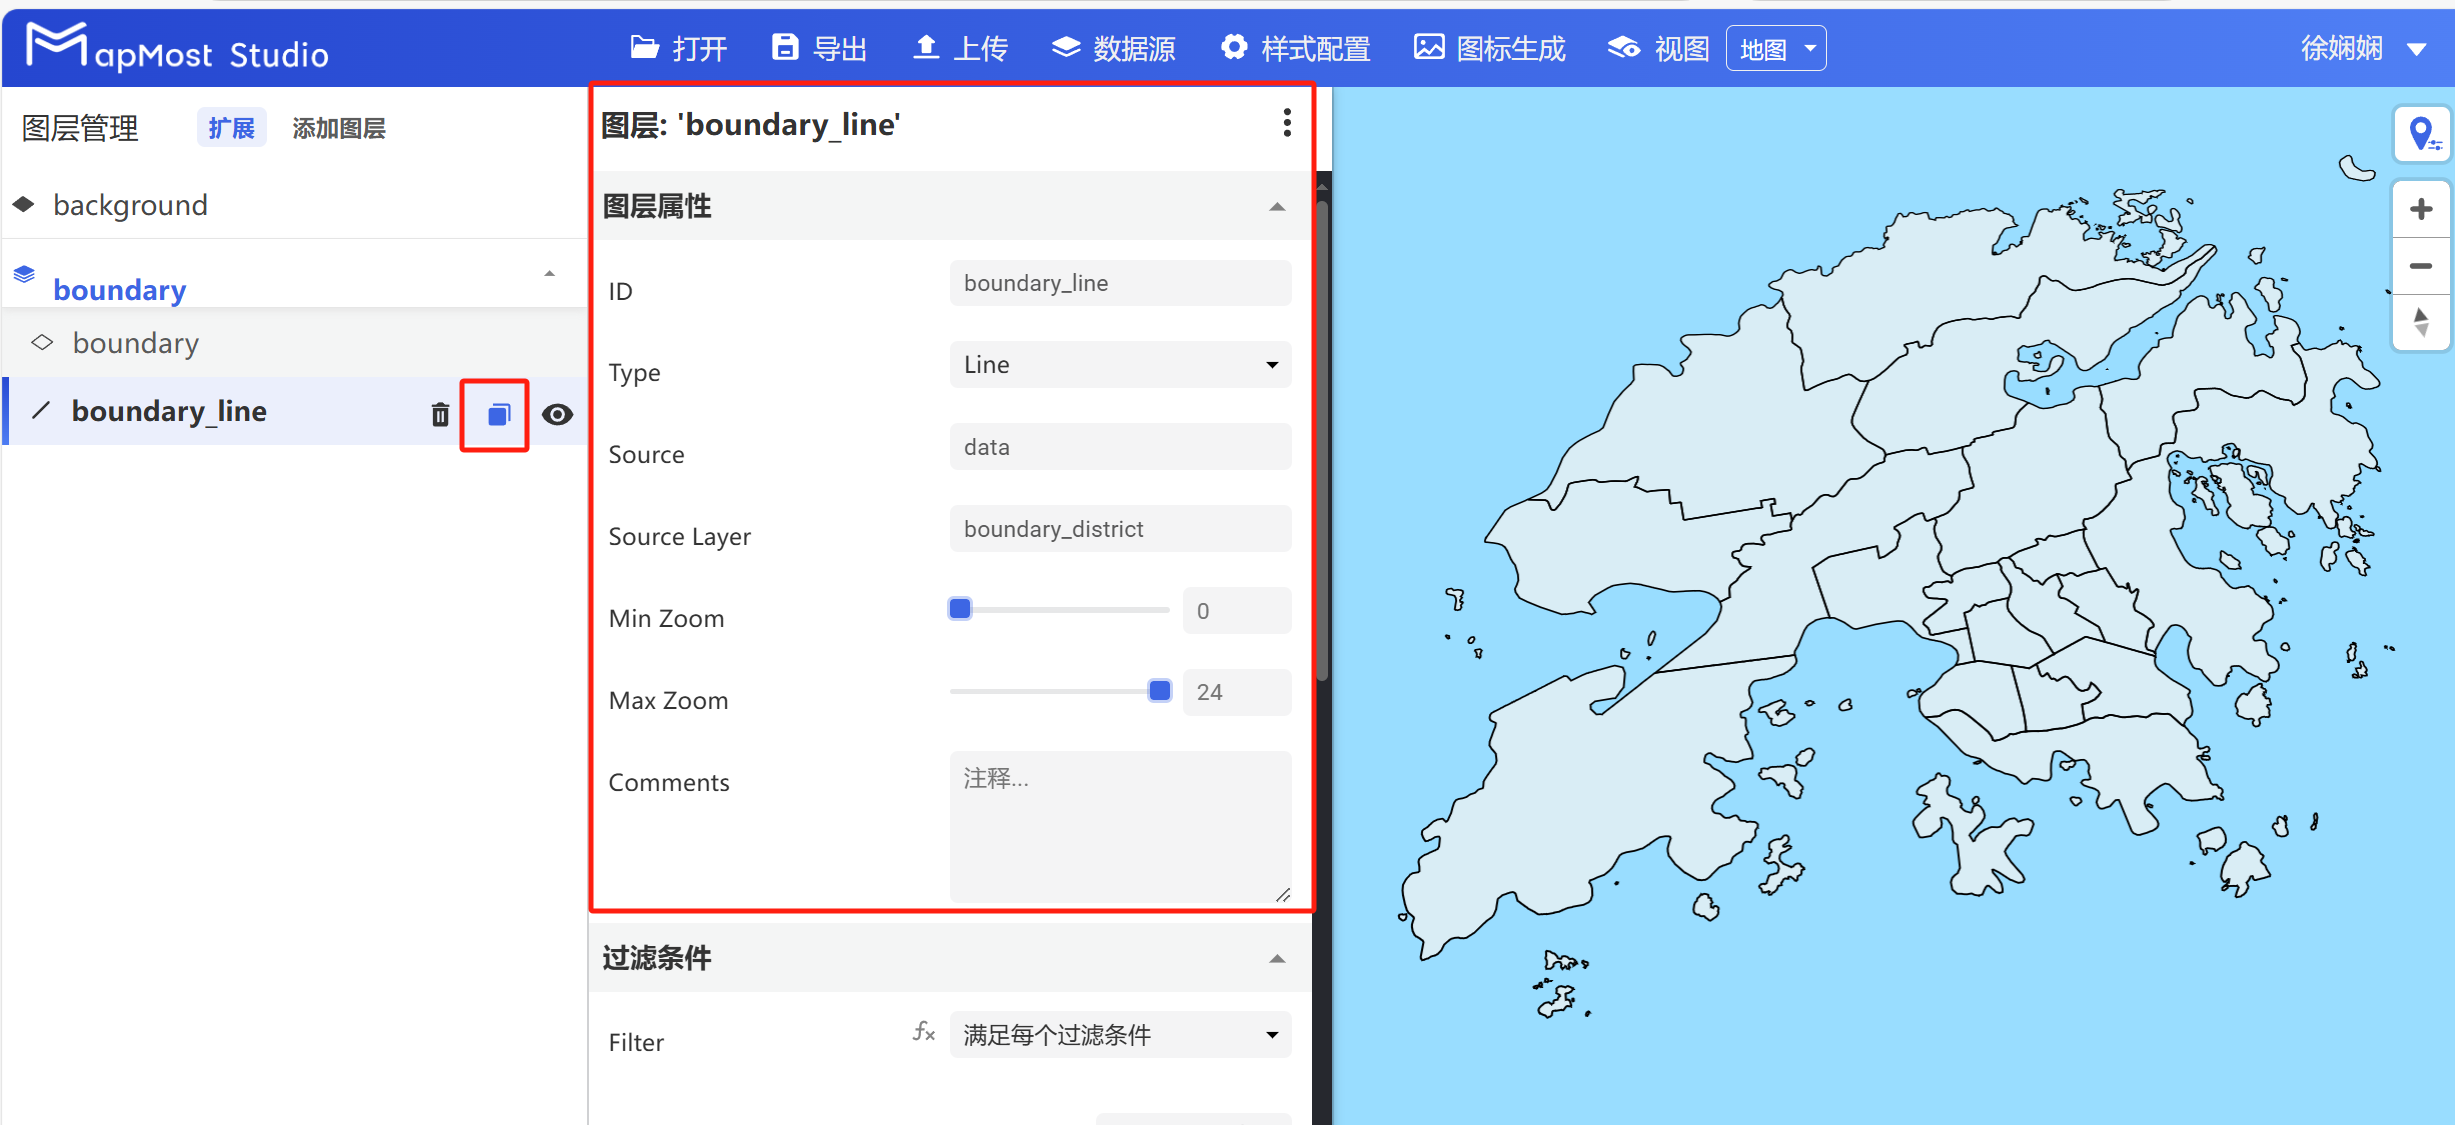
- Copy the "boundary" layer, configure the "Layer Properties" module, customize the "ID" to "boundary_line", select "Line" for "Type", and change the display level;
5.2.5. Modify the "boundary_line" layer
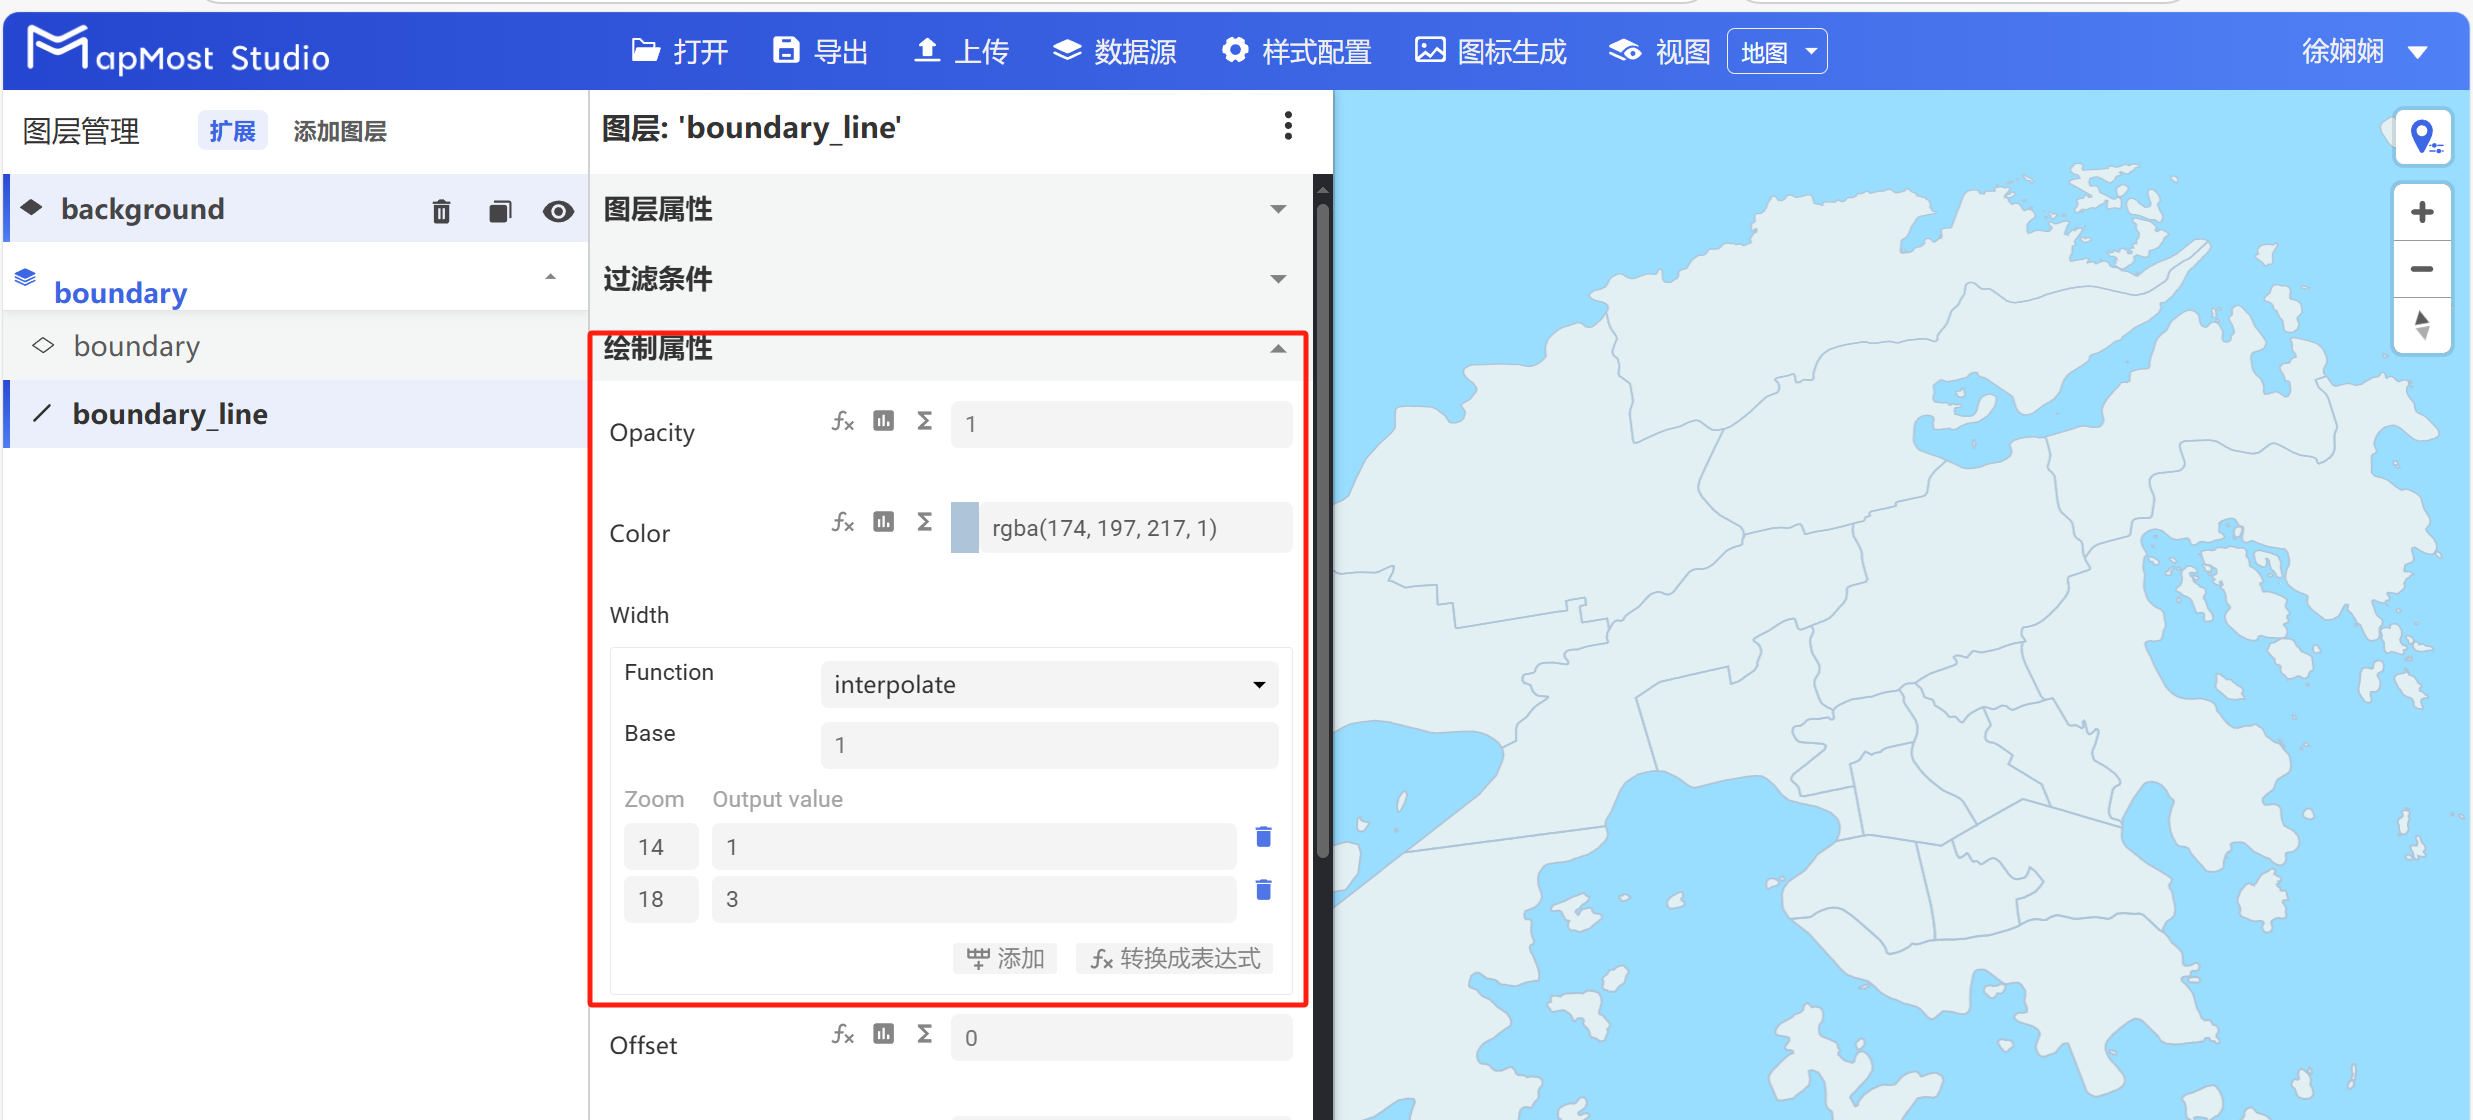
- Select the "boundary_line" layer and modify the stroke color and stroke thickness in the "Drawing Properties" module;
5.3. Add land use type layer and set layer properties
5.3.1. Configure the "Add Layer" pop-up window
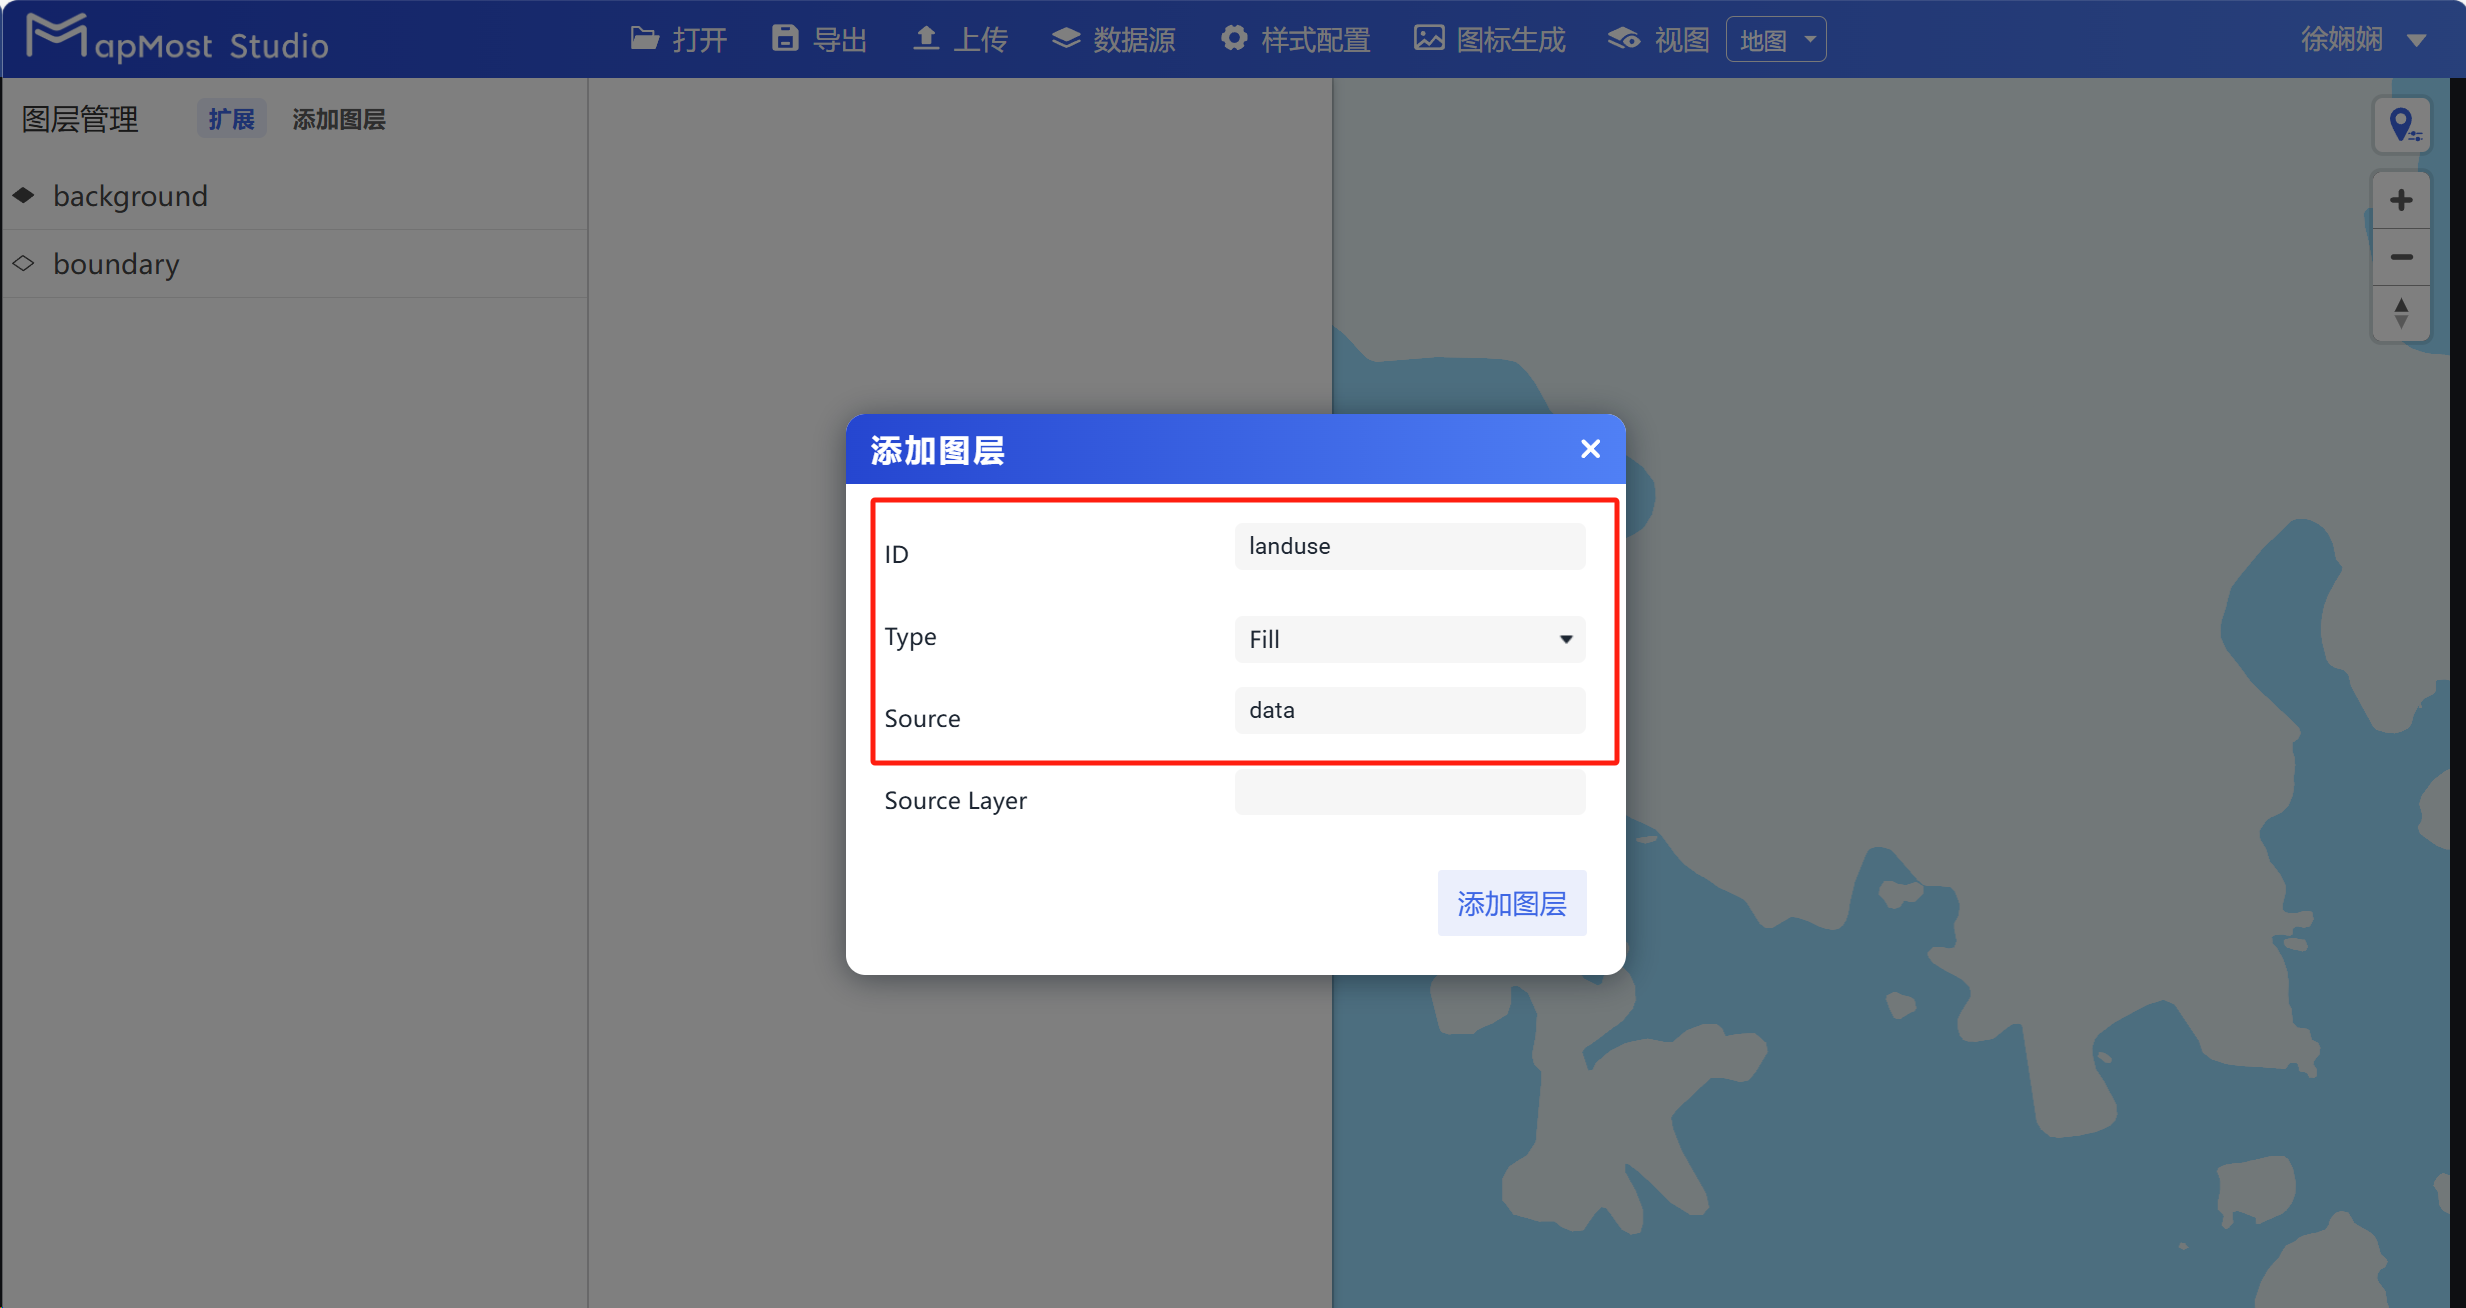
- Click the "Add Layer" button to add a land use type layer, customize the "ID" to "landuse", "Type" to "Fill", and "Source" to "data";
5.3.2. Configure the "Layer Properties" module
- Select the "landuse" layer, configure the "Layer Properties" module, select "landuse_joint" for "SourceLayer", and modify the layer display level;
5.3.3. Add filter conditions
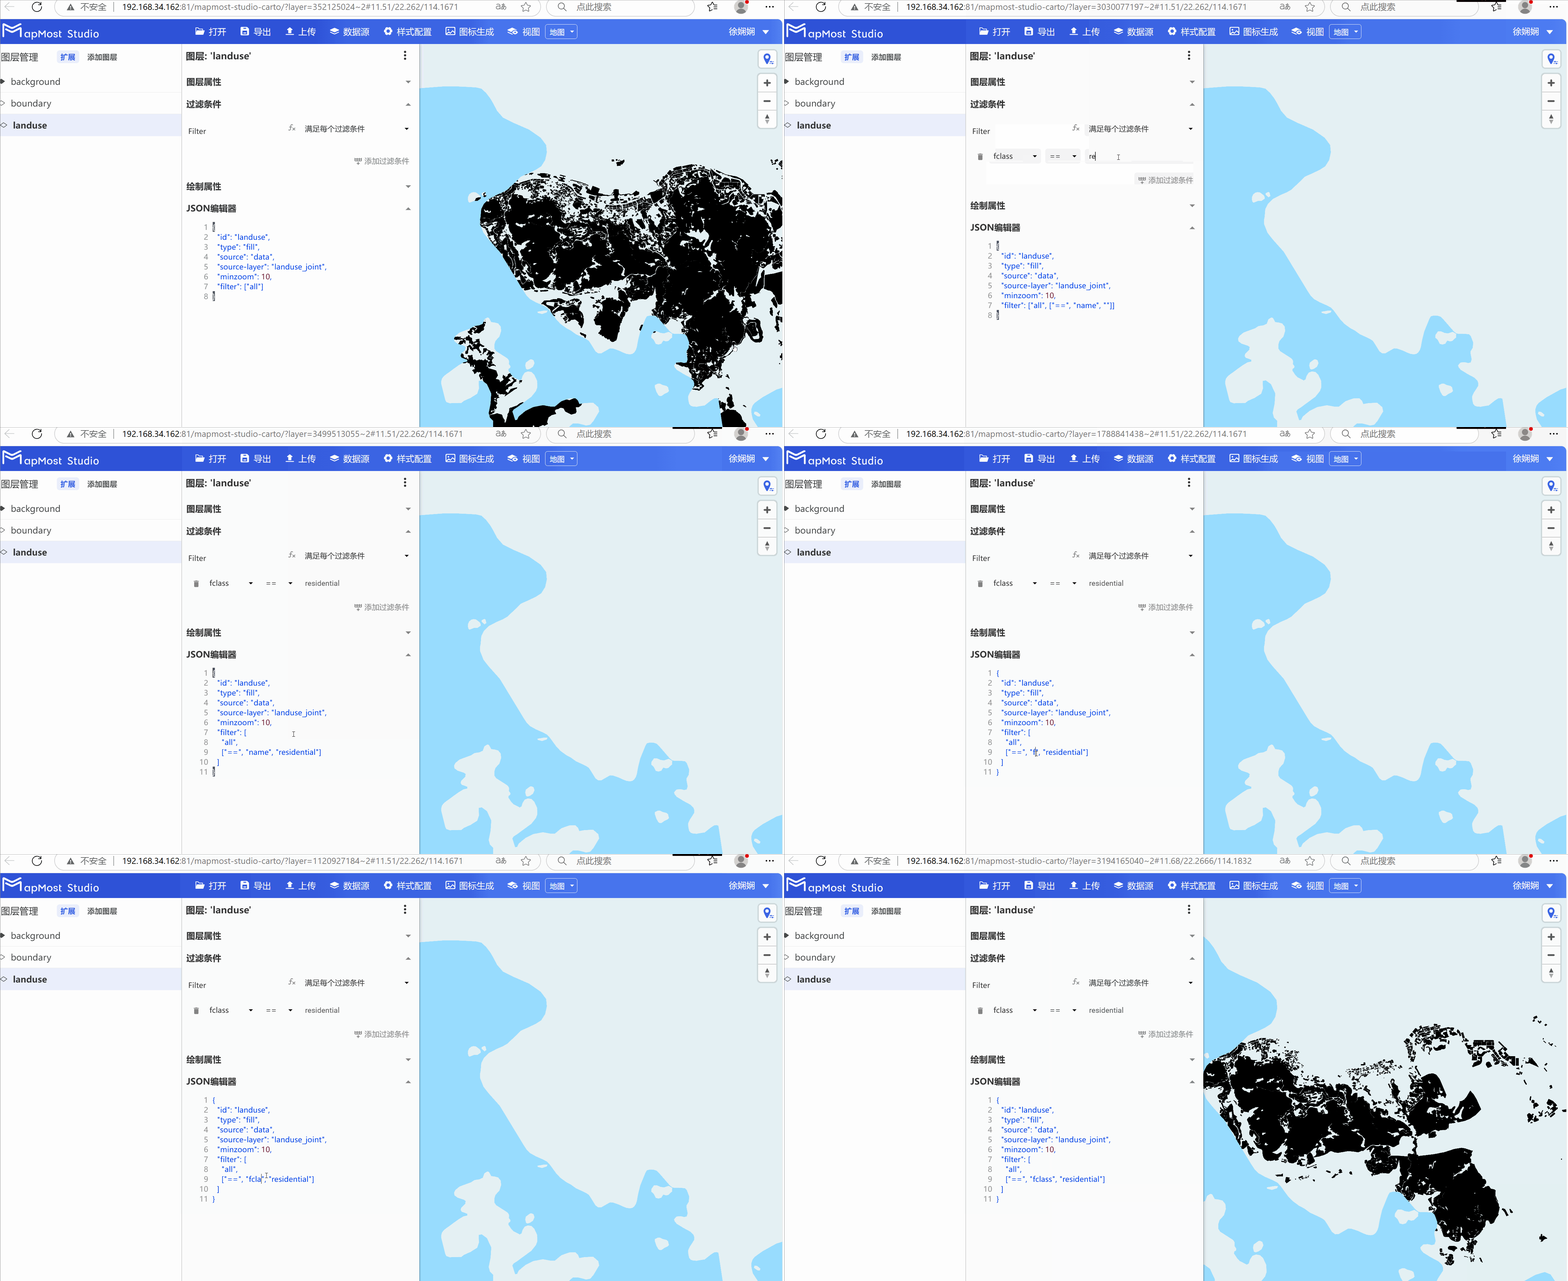
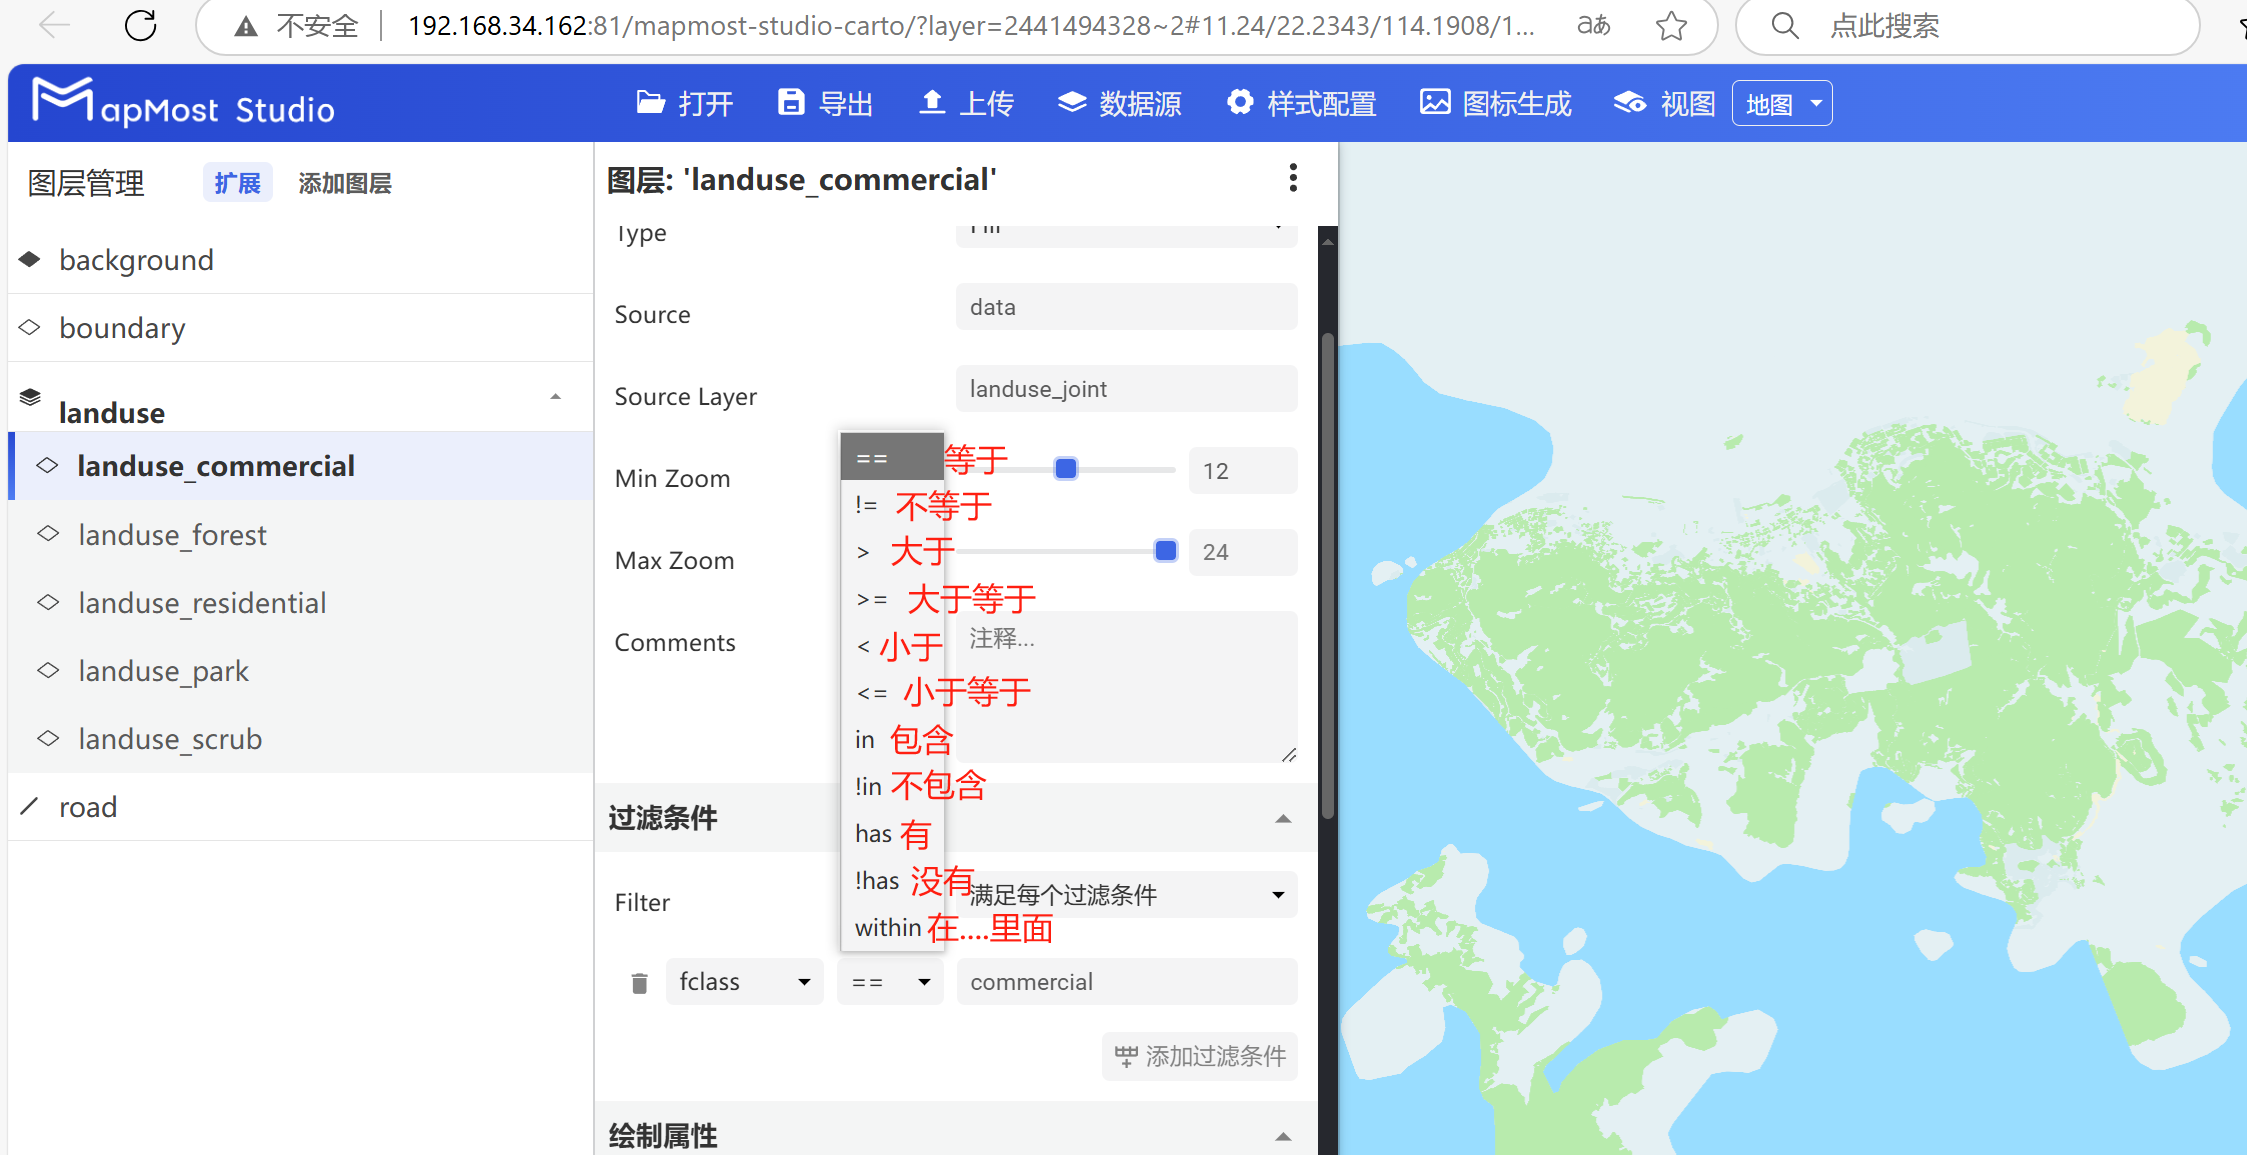
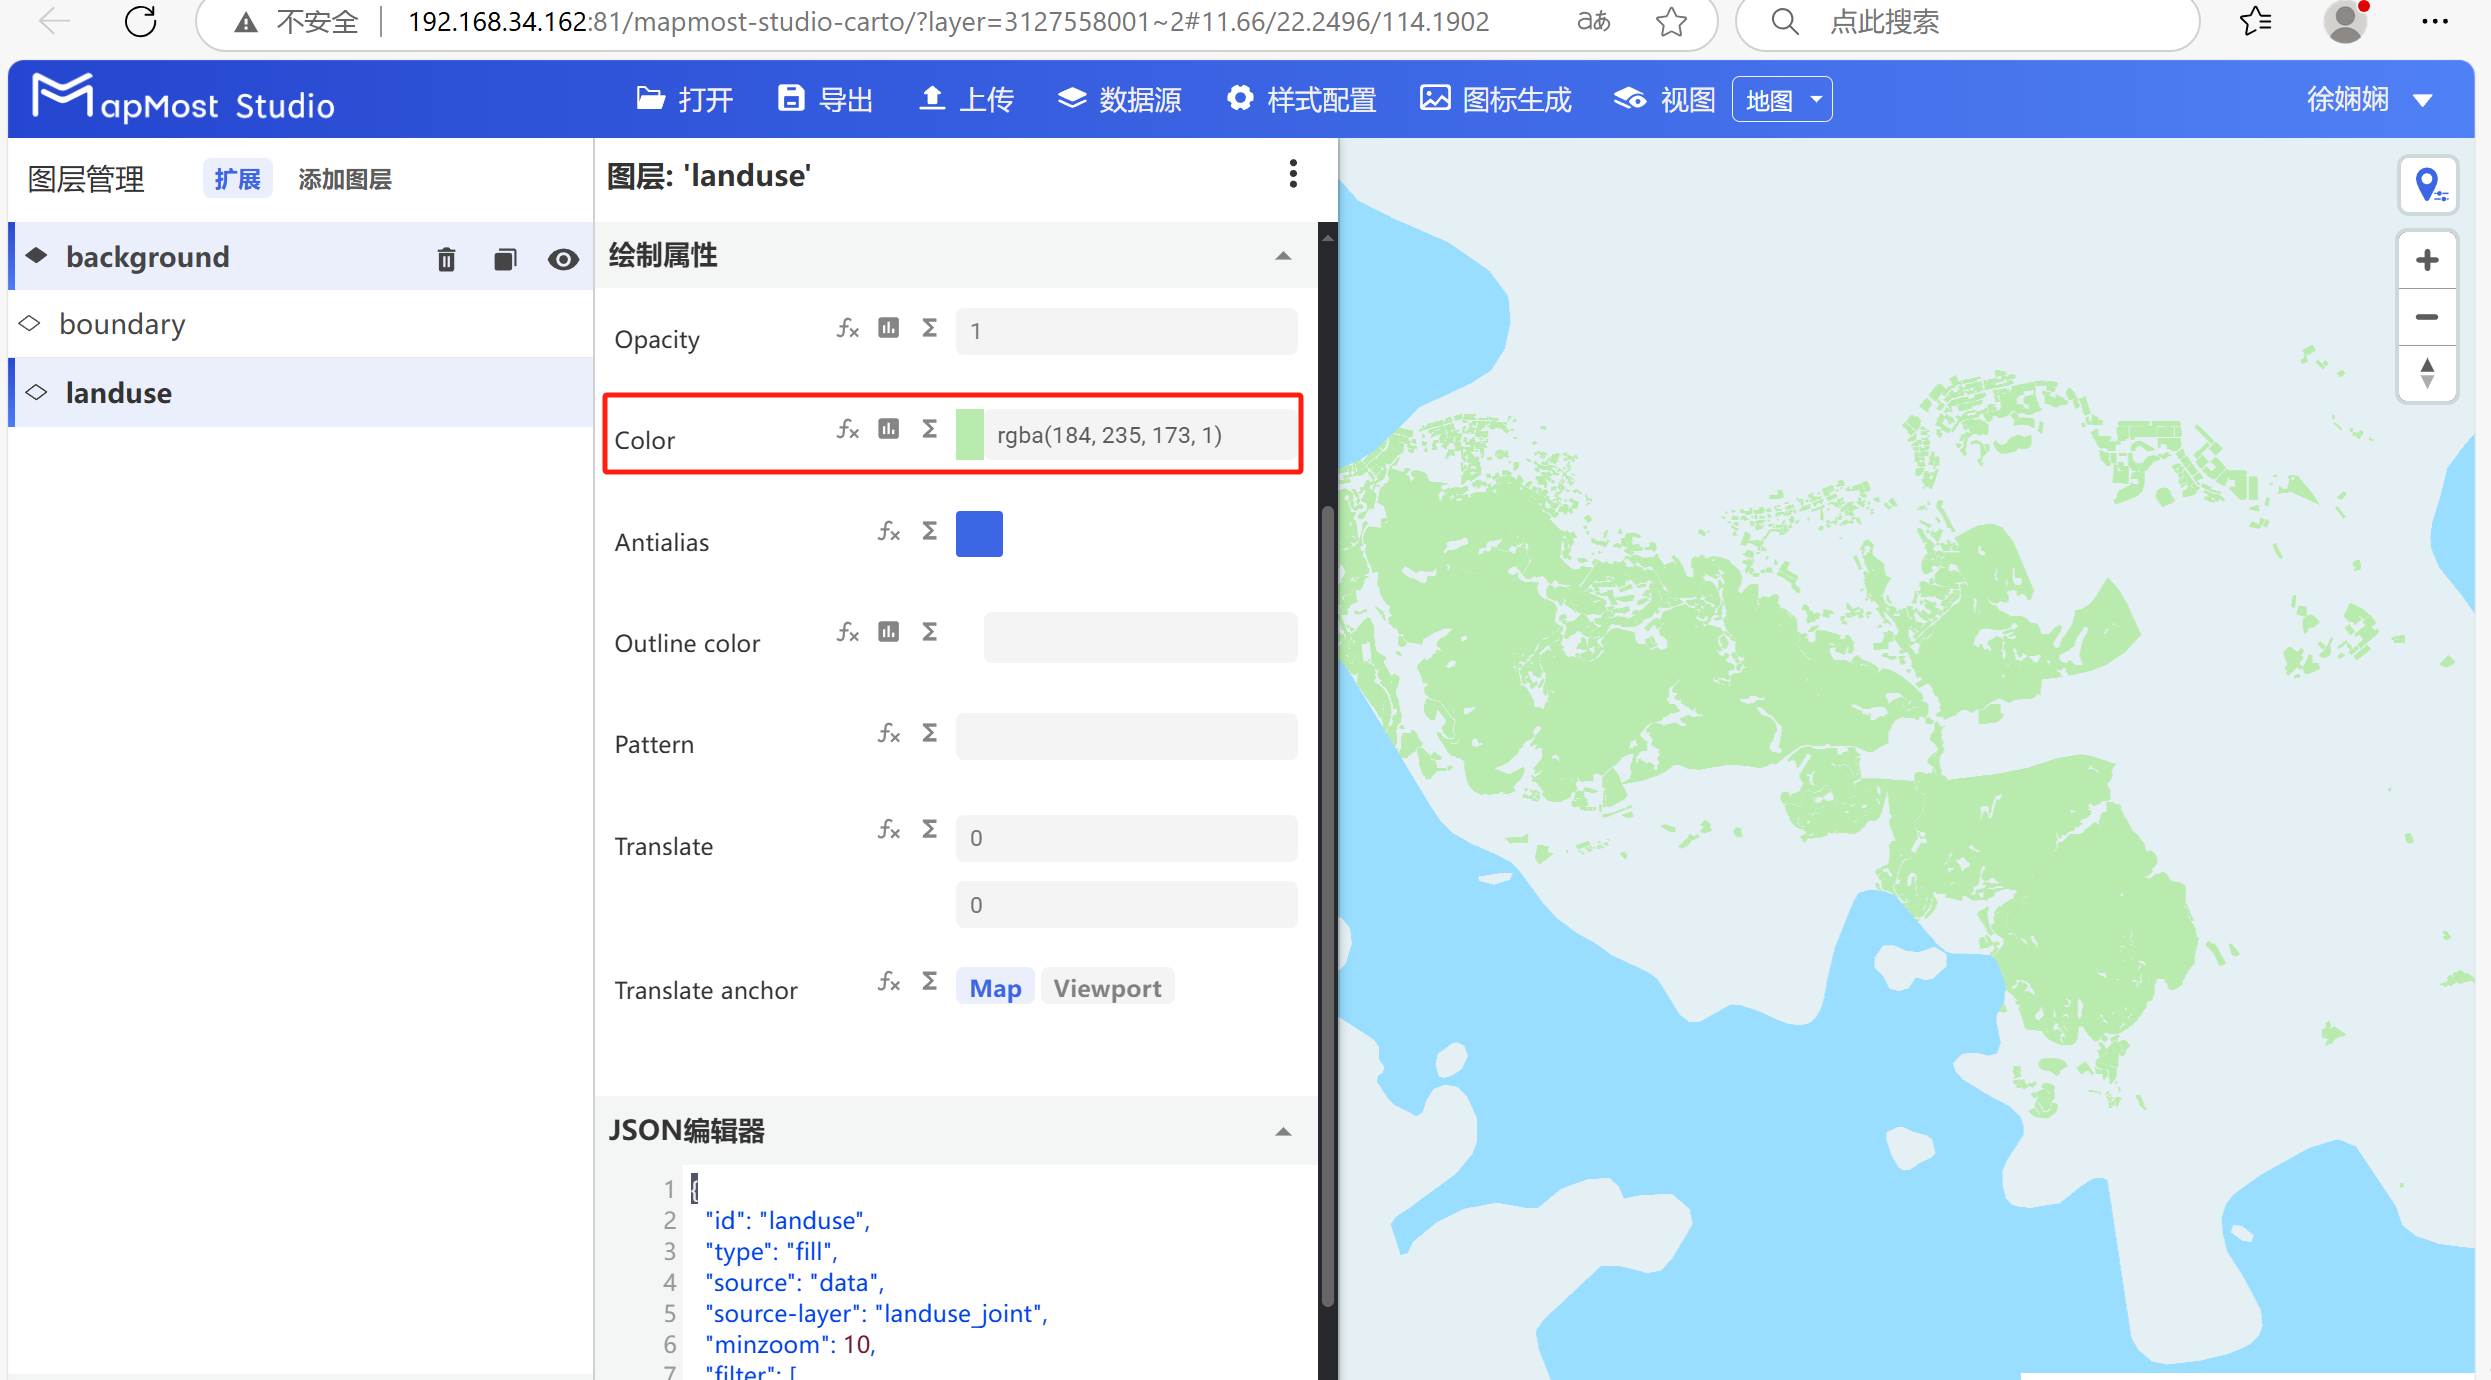
- Select the "landuse" layer, configure the "Filter Conditions" module, and filter out the surface data whose "fclass" is "residential". The operation method is shown in Figure 1 below, and the filtering conditions are shown in Figure 2 (if the filtering results are not displayed, you can check the "JSON Editor" module information).
5.3.4. Configure the "Drawing Properties" module
- Select the "landuse" layer and modify the surface color in the "Drawing Properties" module;
5.3.5. Duplicate the "landuse" layer
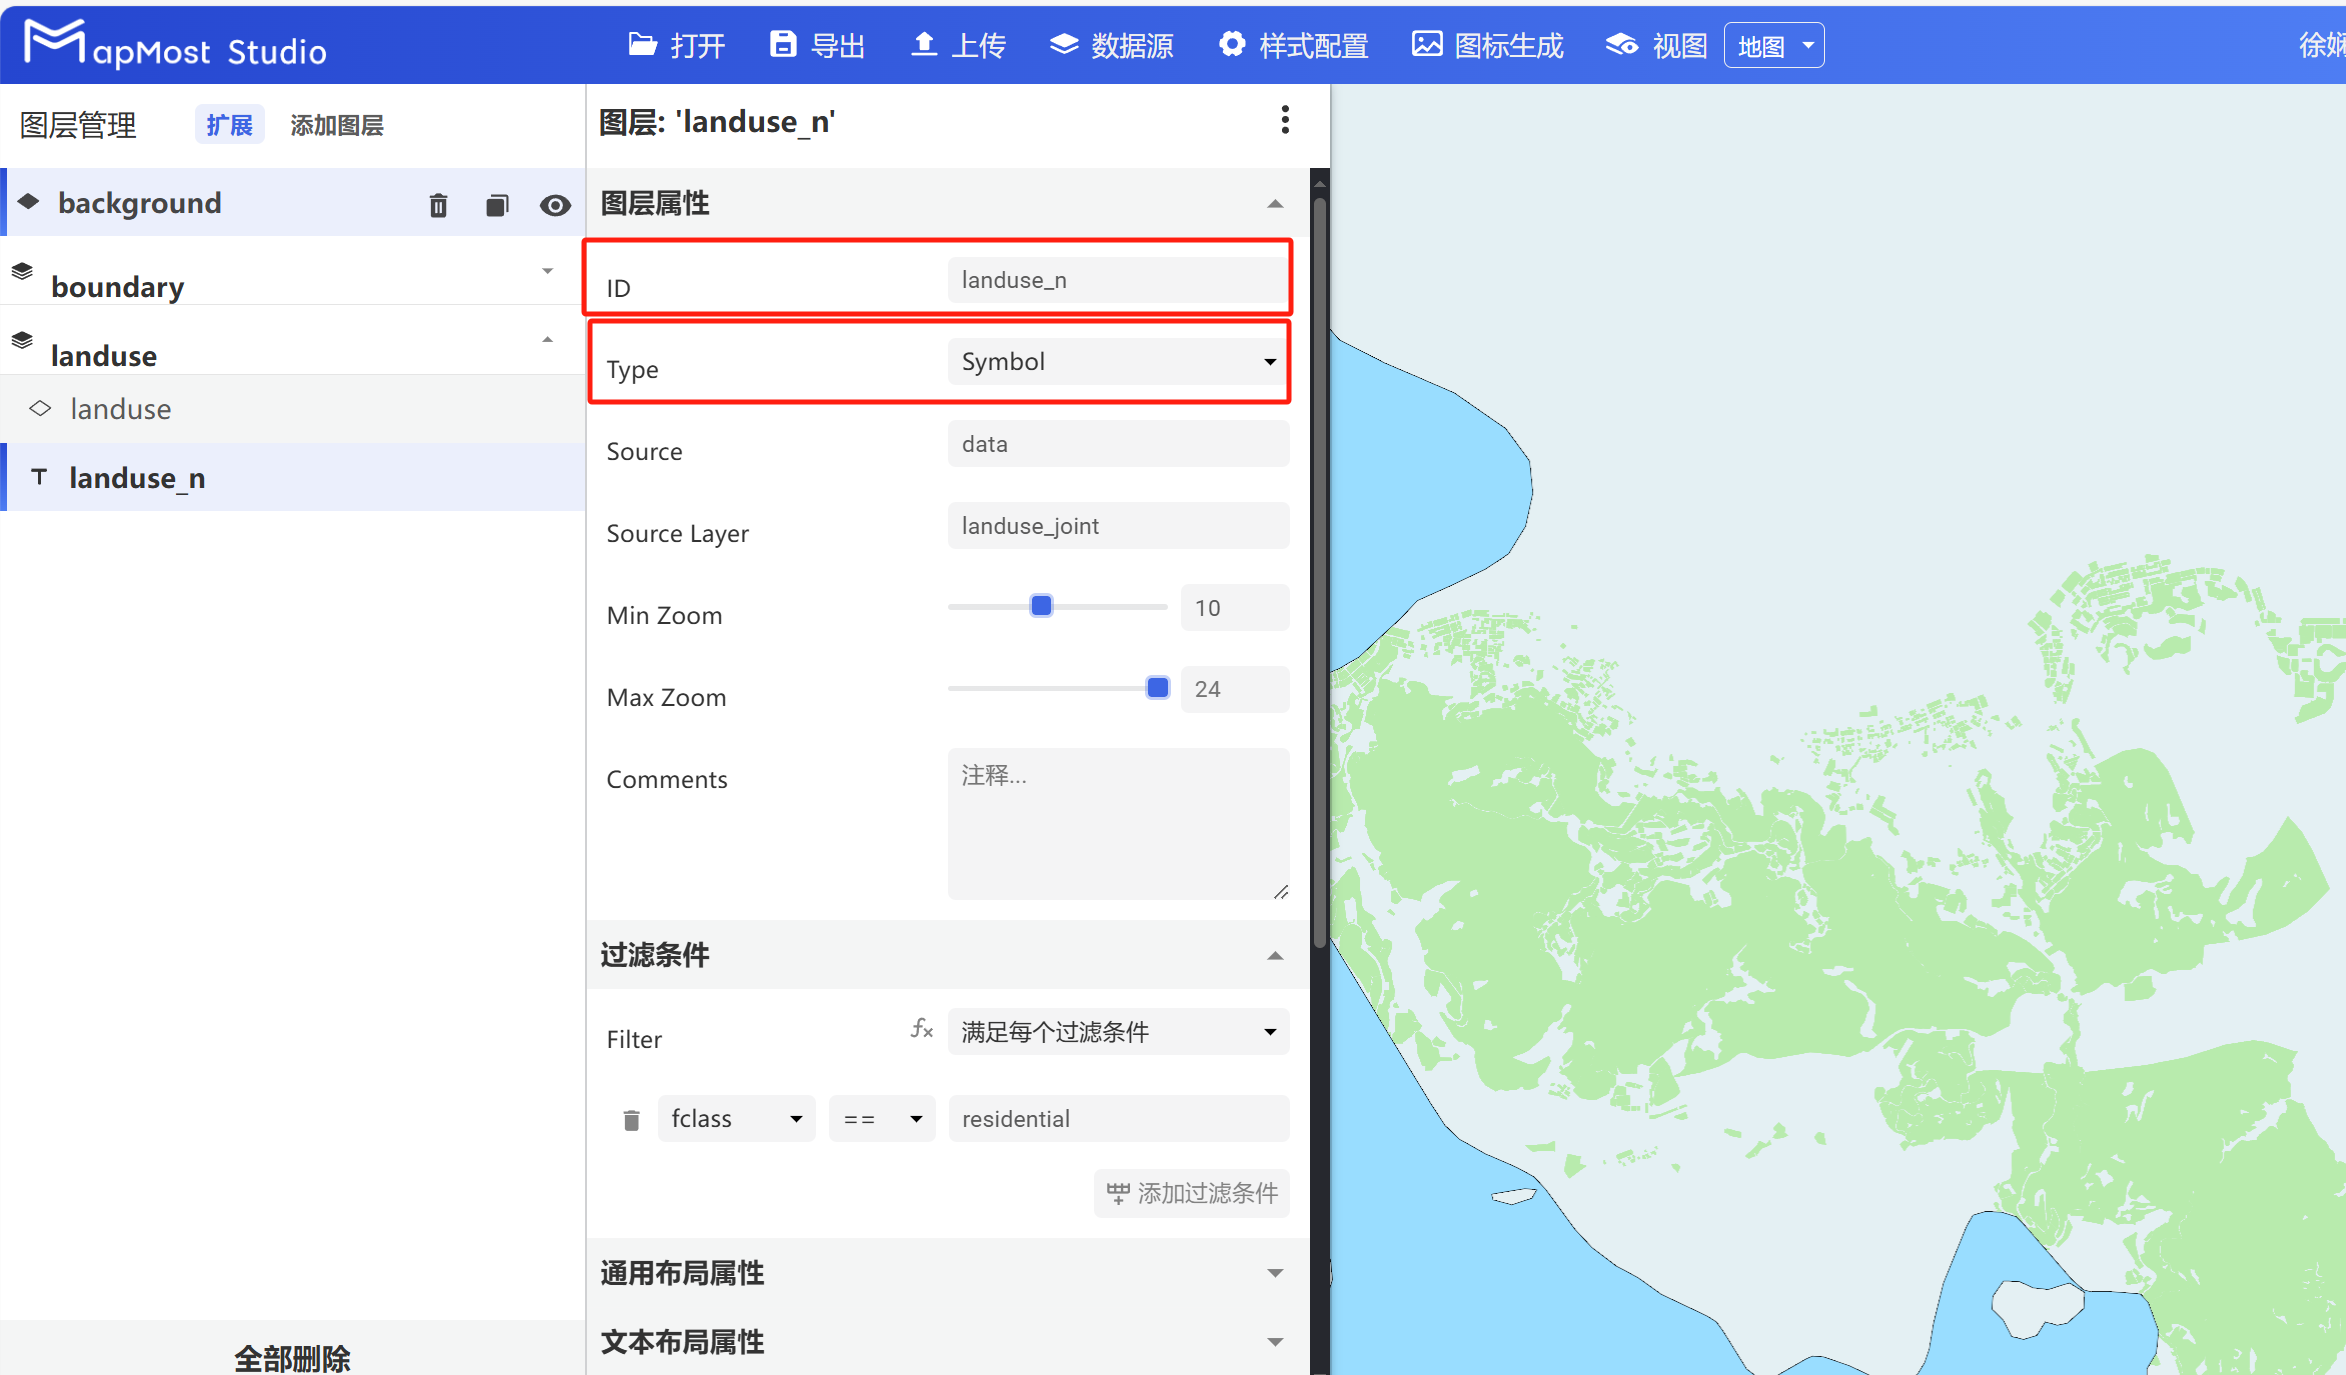
- Copy the "landuse" layer, configure the "Layer Properties" module, modify the "ID" name to "landuse_n", and adjust the layer order;
5.3.6. Retrieve data fields
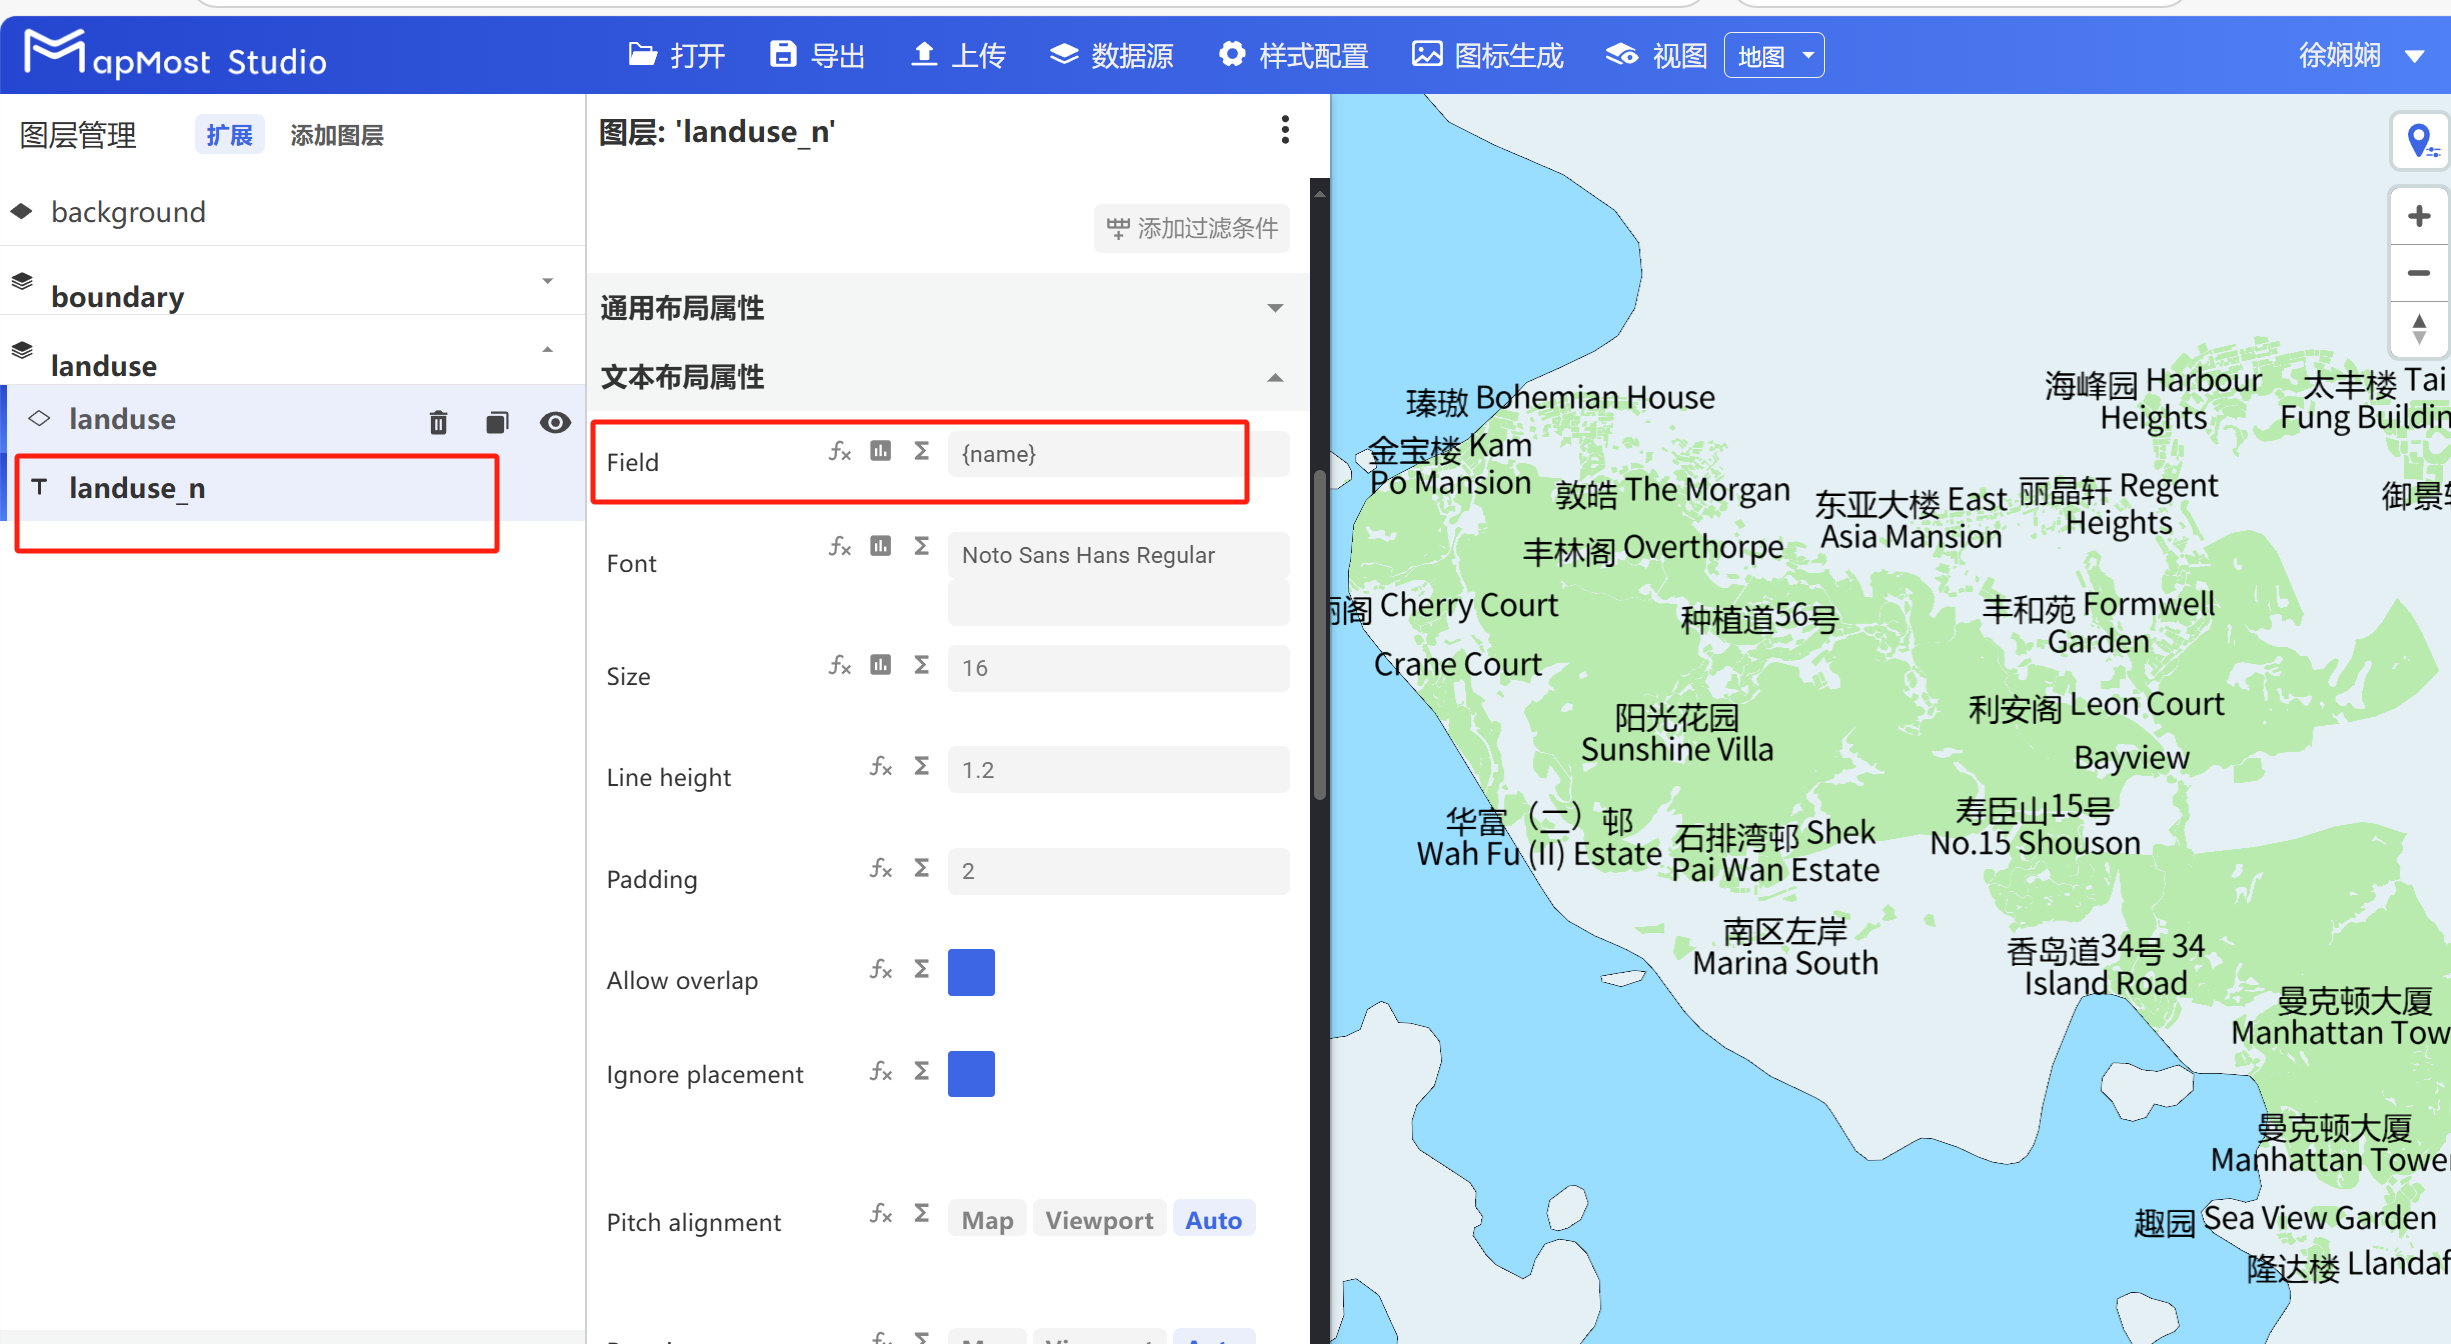
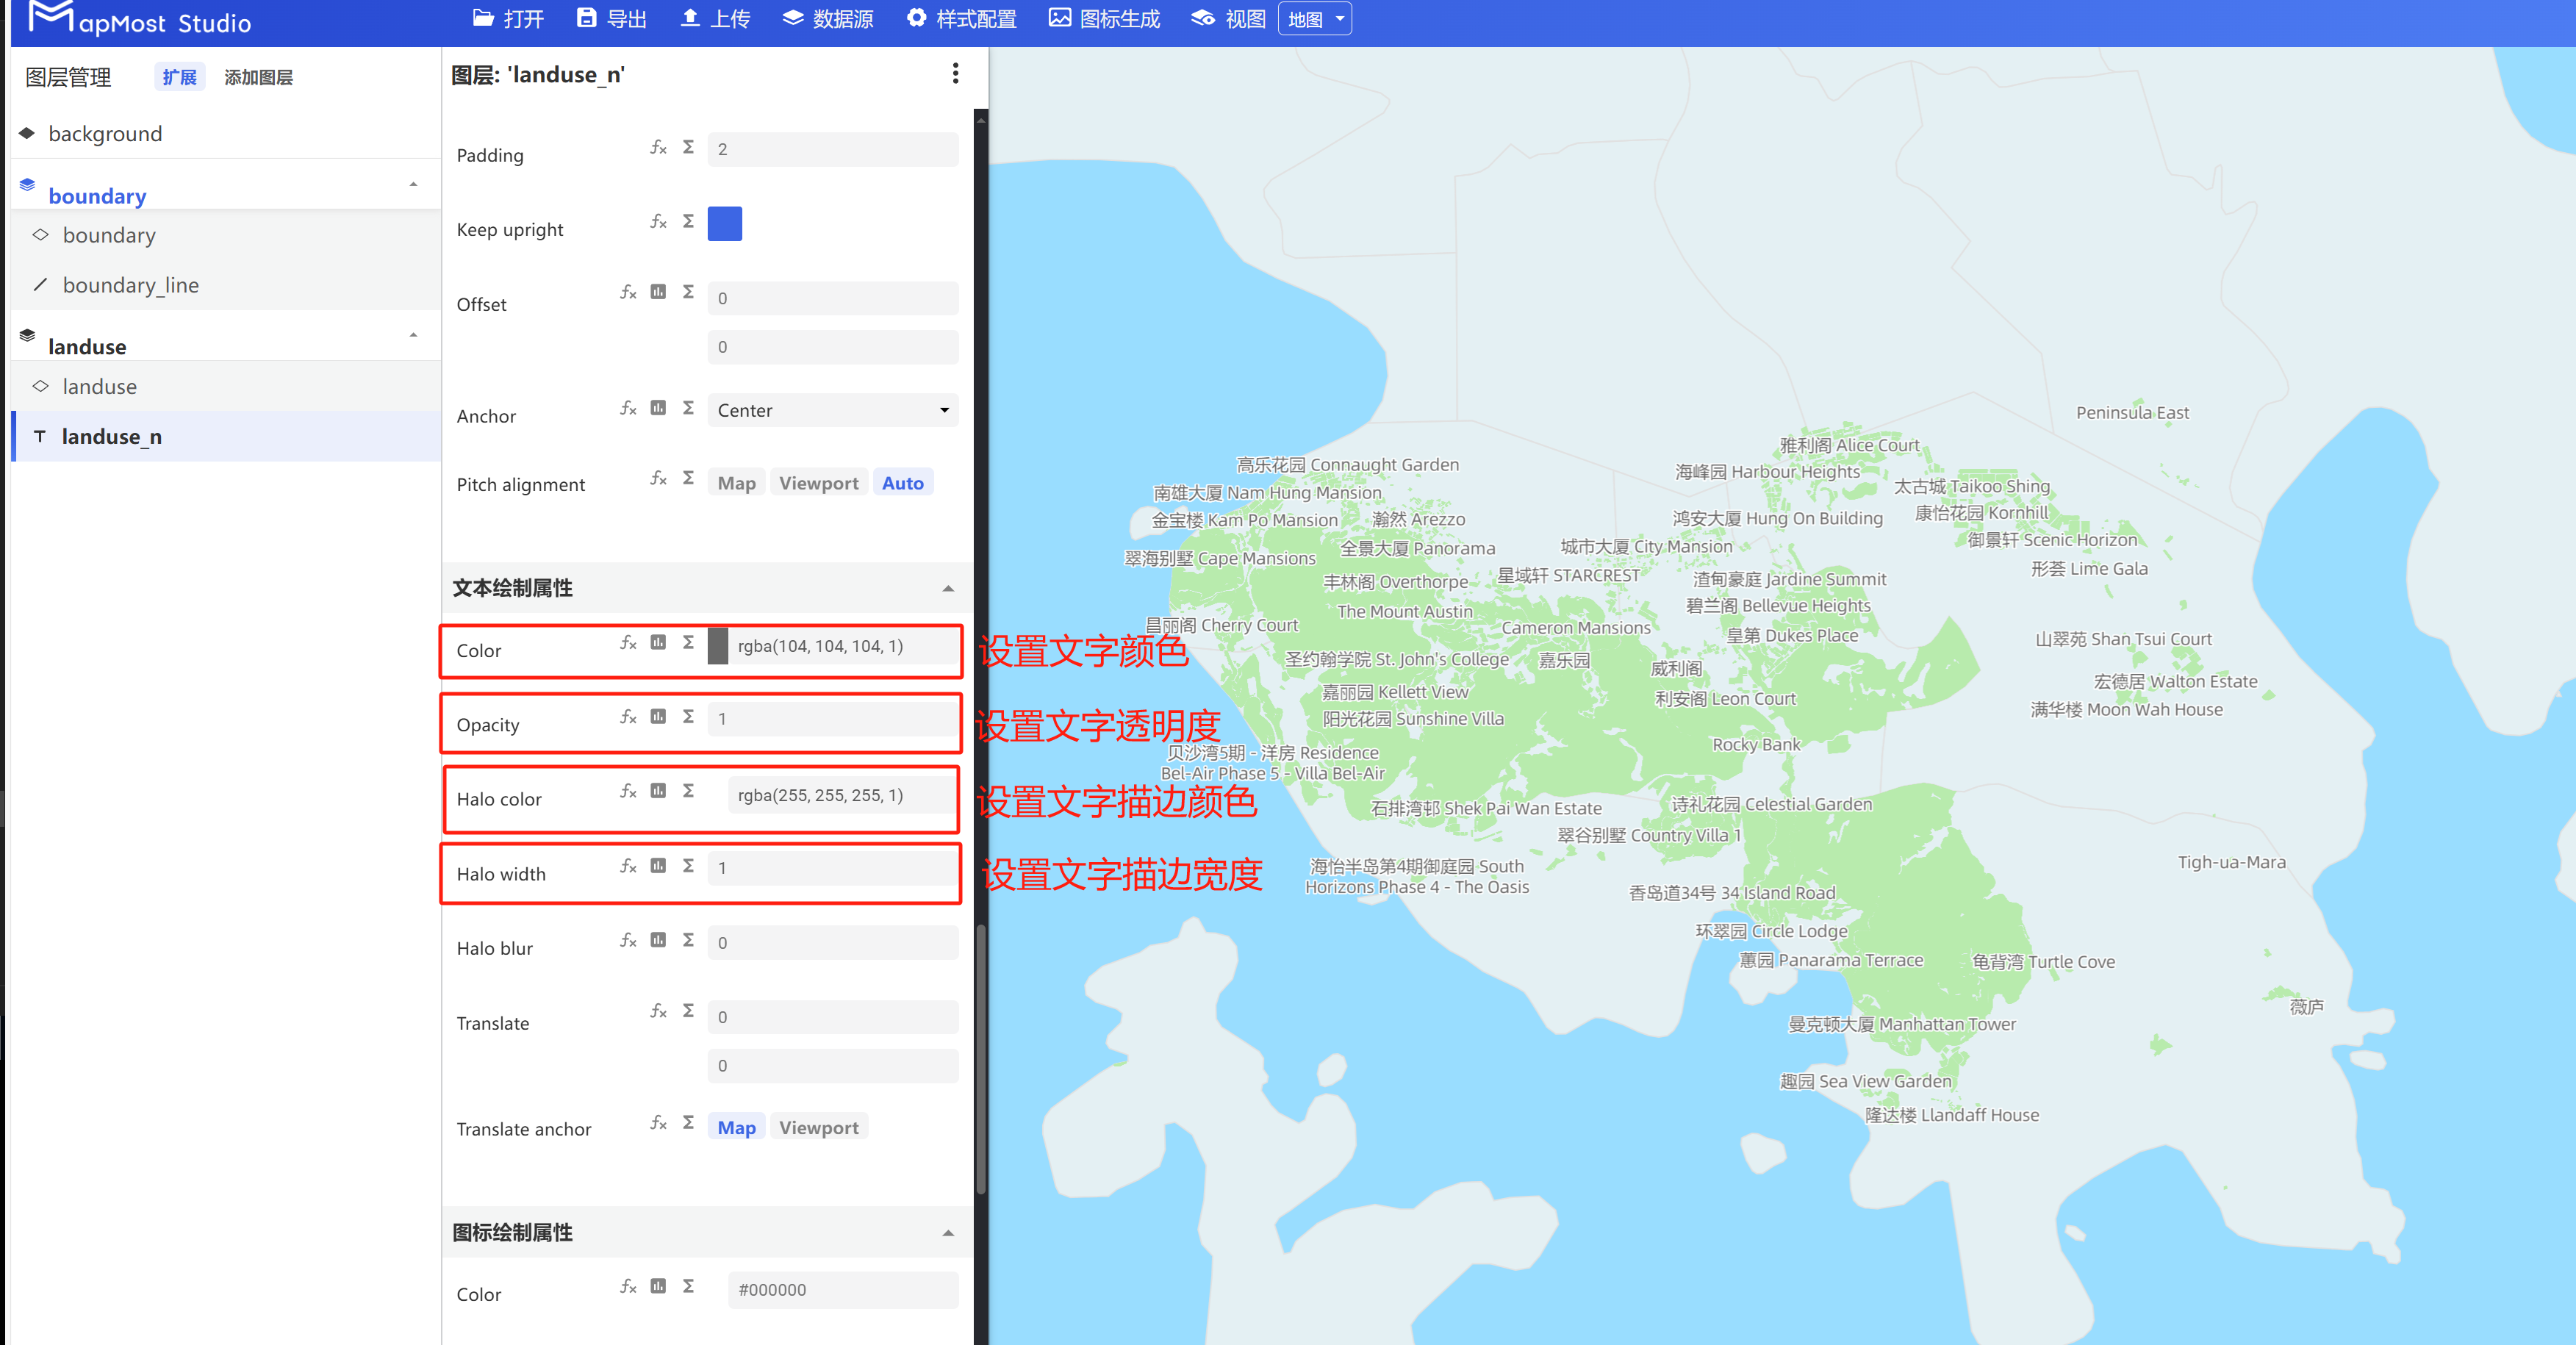
- Select the "landuse_n" layer, configure the "Text Layout Properties" module, fill in "field" as "name", and call the name field contained in the data;
5.3.7. Configure the "Text Layout Properties" module
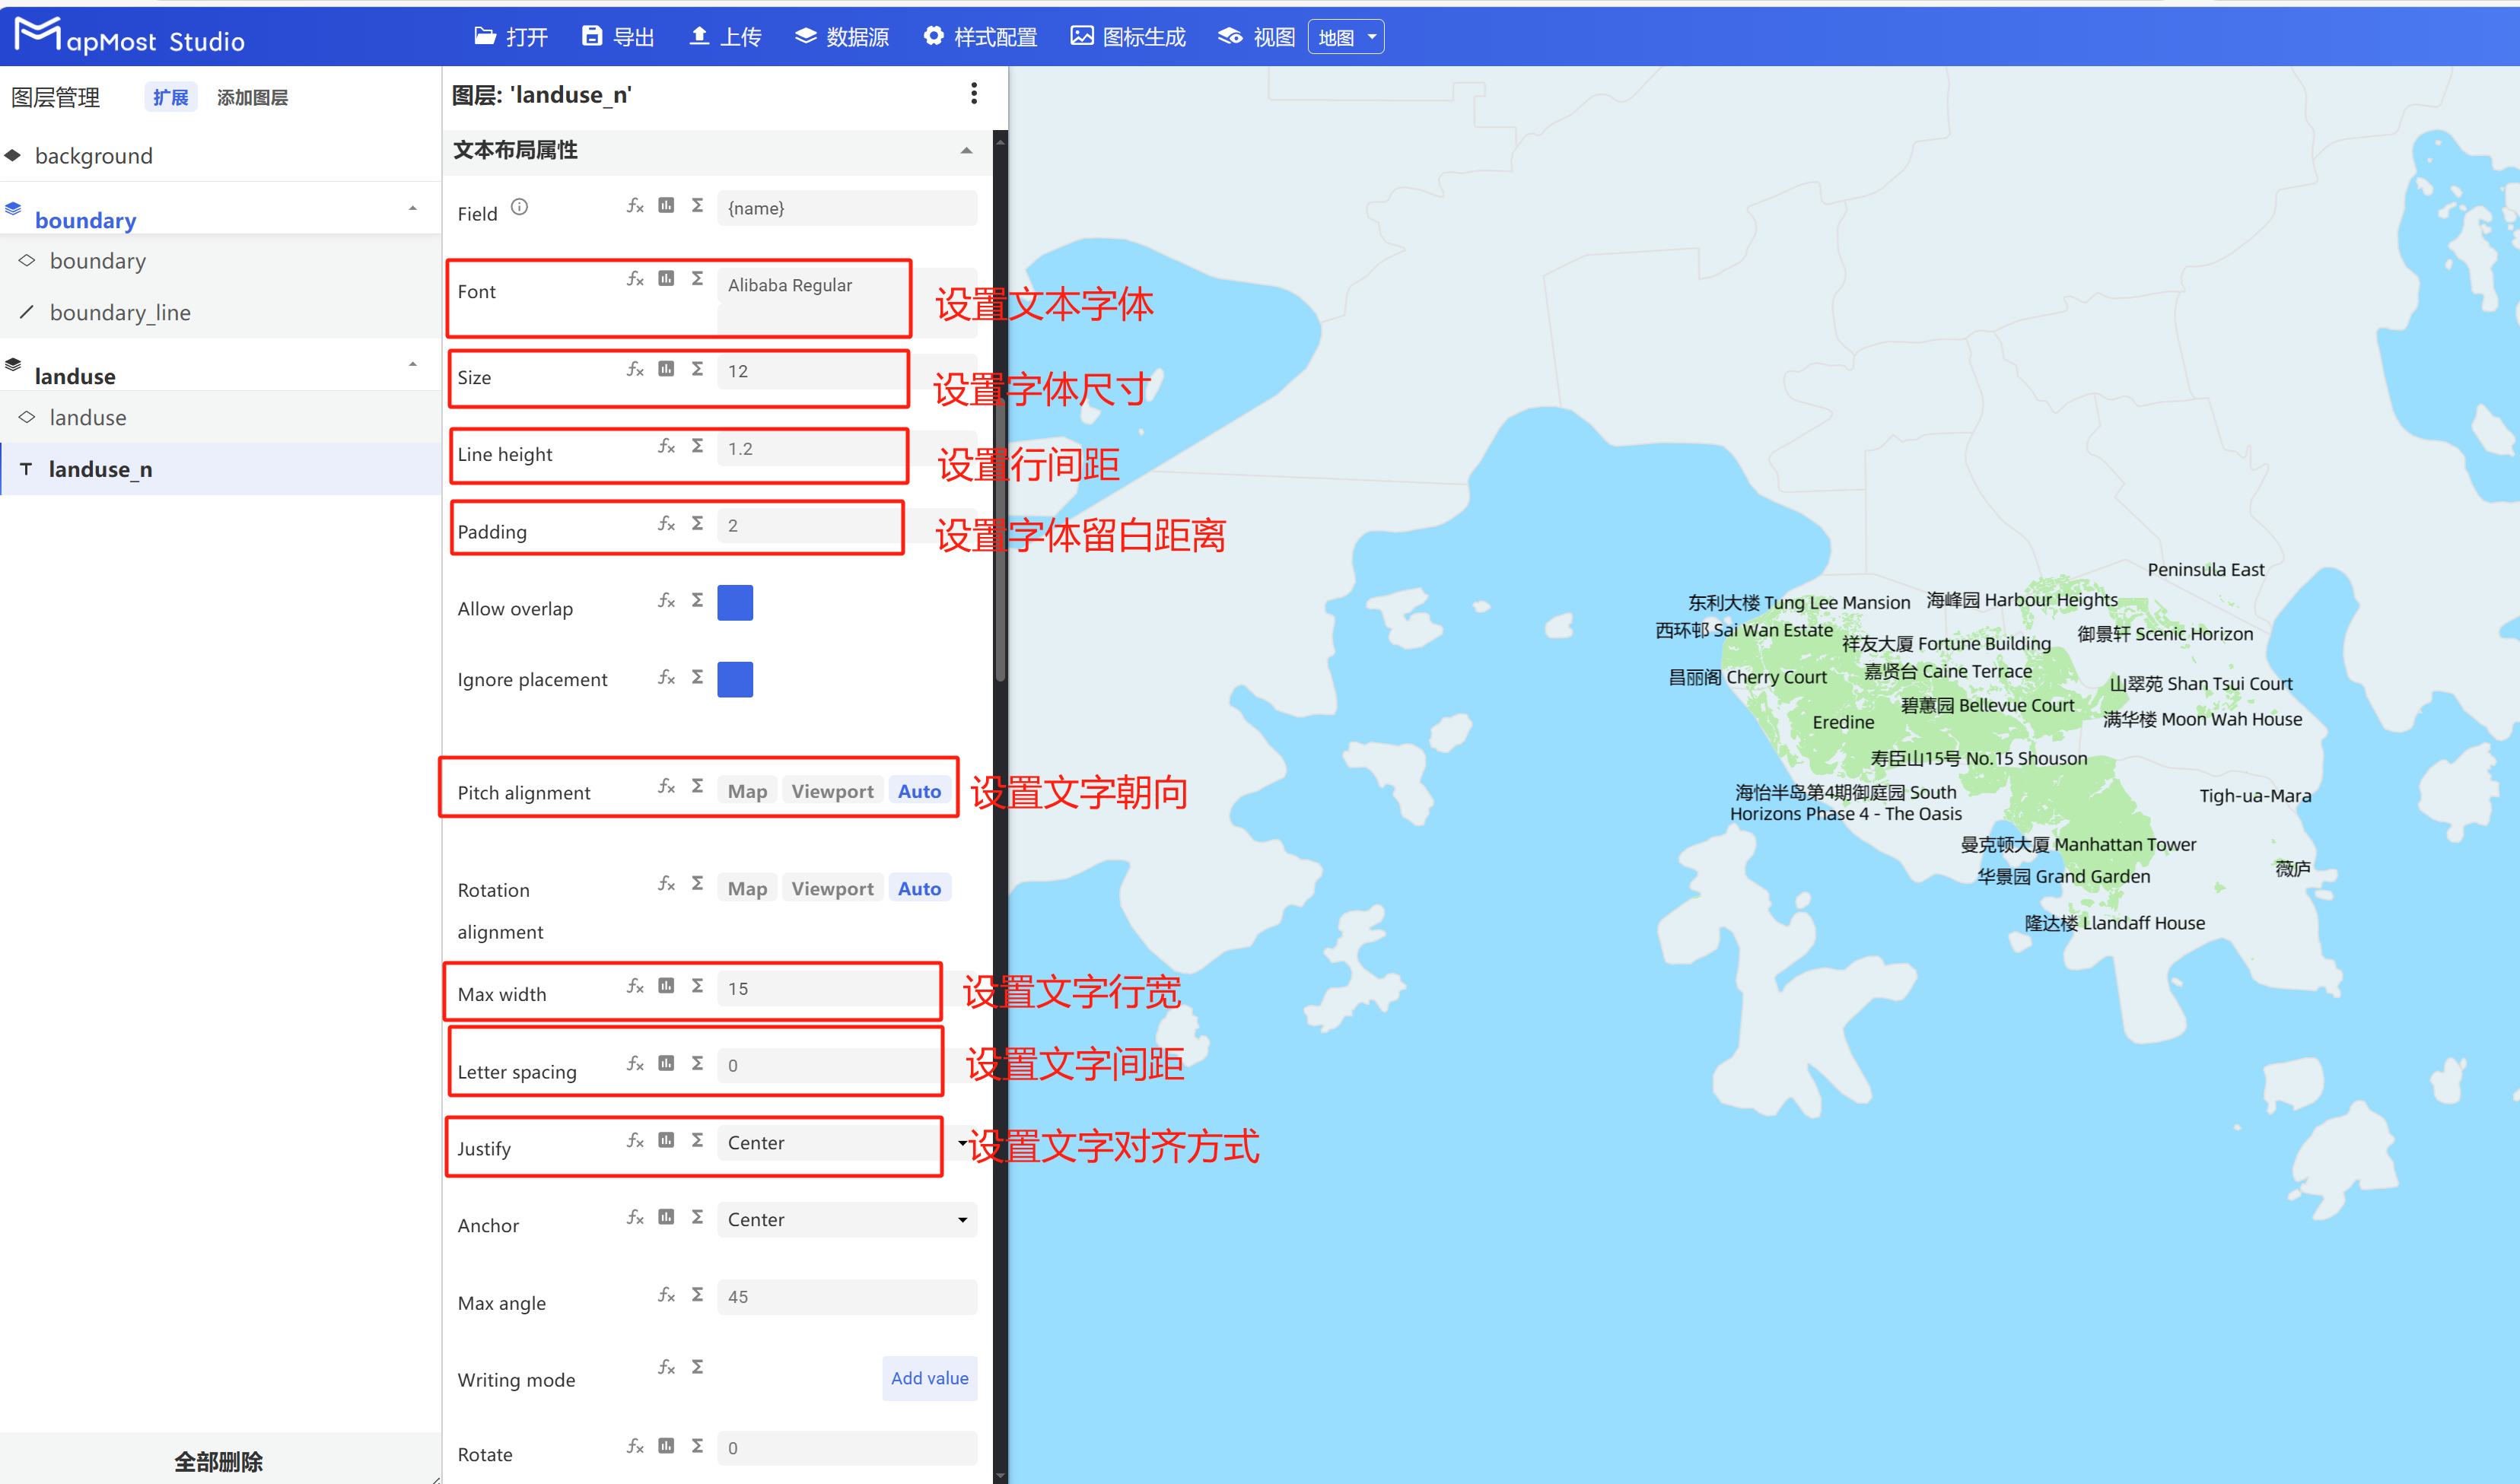
- Select the "landuse_n" layer, configure the "Text Layout Properties" module, and configure basic text properties, such as: font, size, line spacing, line width, alignment, text color, transparency, stroke color, stroke thickness, etc.;
5.3.8. Enrich map styles
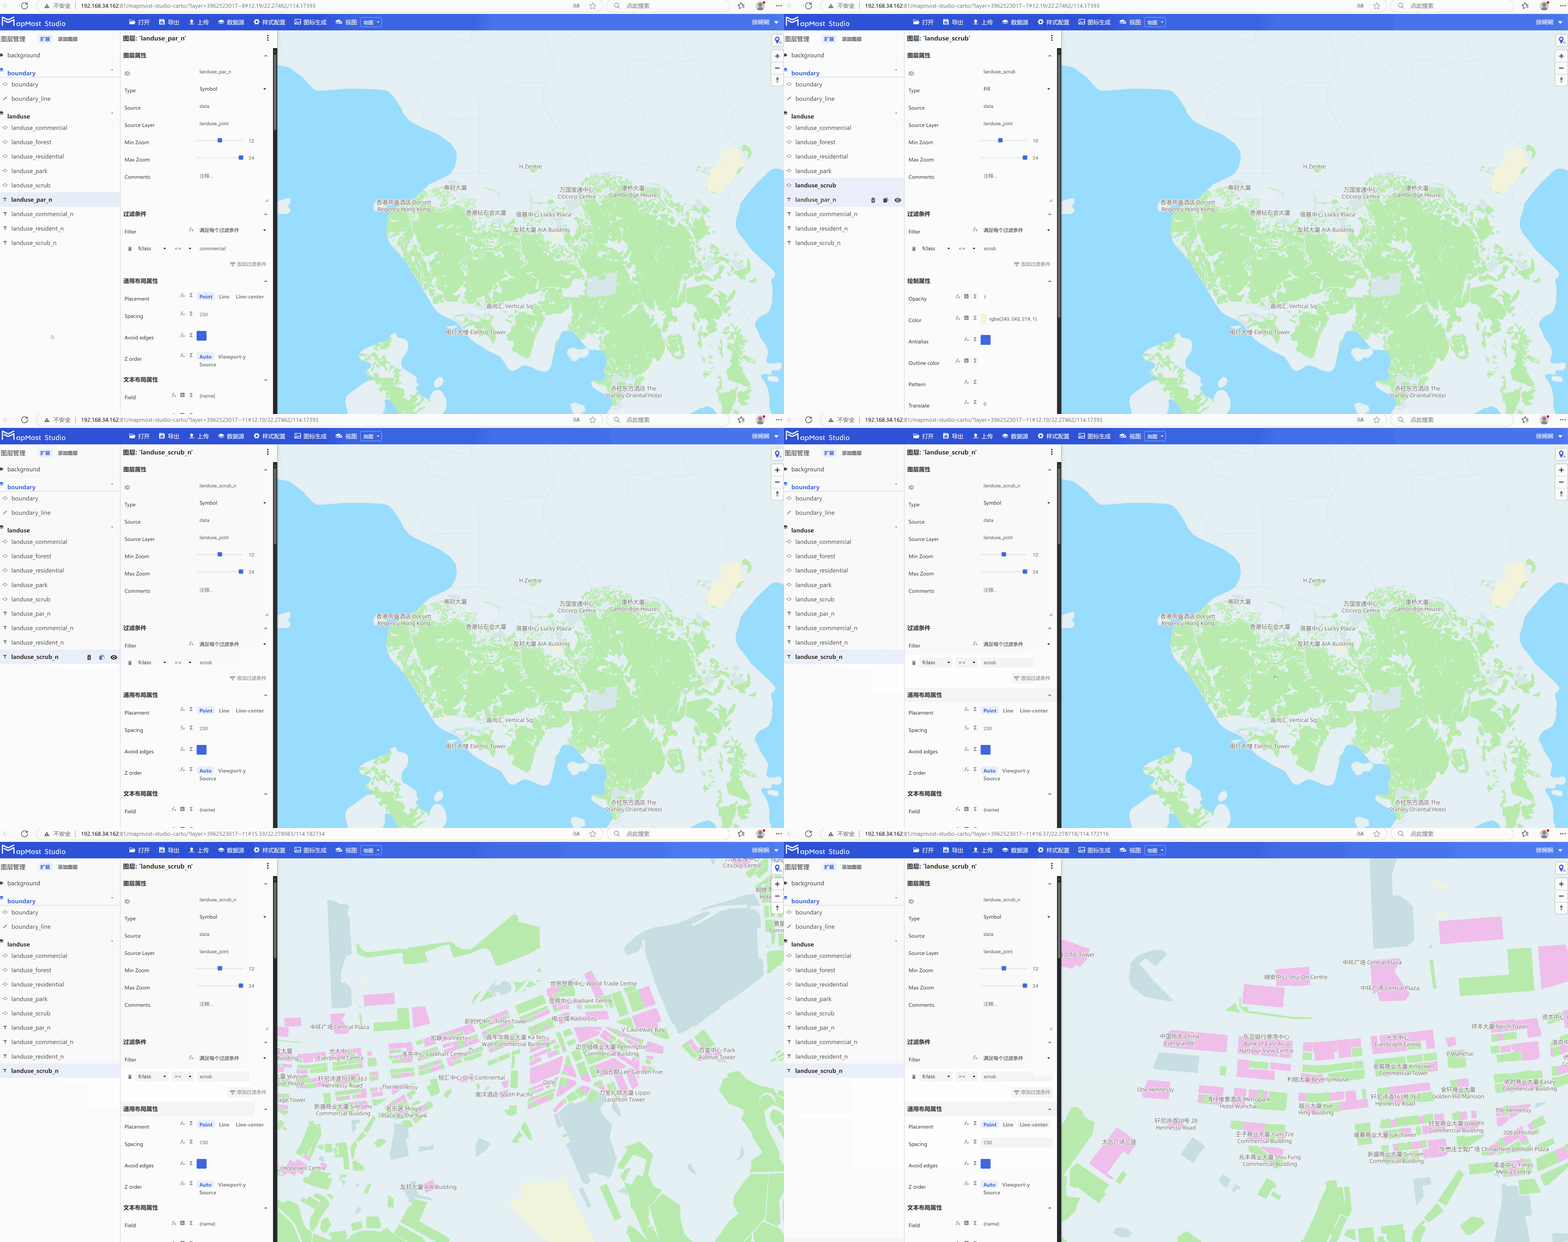
- Refer to steps 6.3.1-6.3.8 to display more land use type data and improve the richness of the map effect (pay attention to adjusting the layer order);
5.4. Add road layer and set layer properties
5.4.1. Configure the "Add Layer" pop-up window
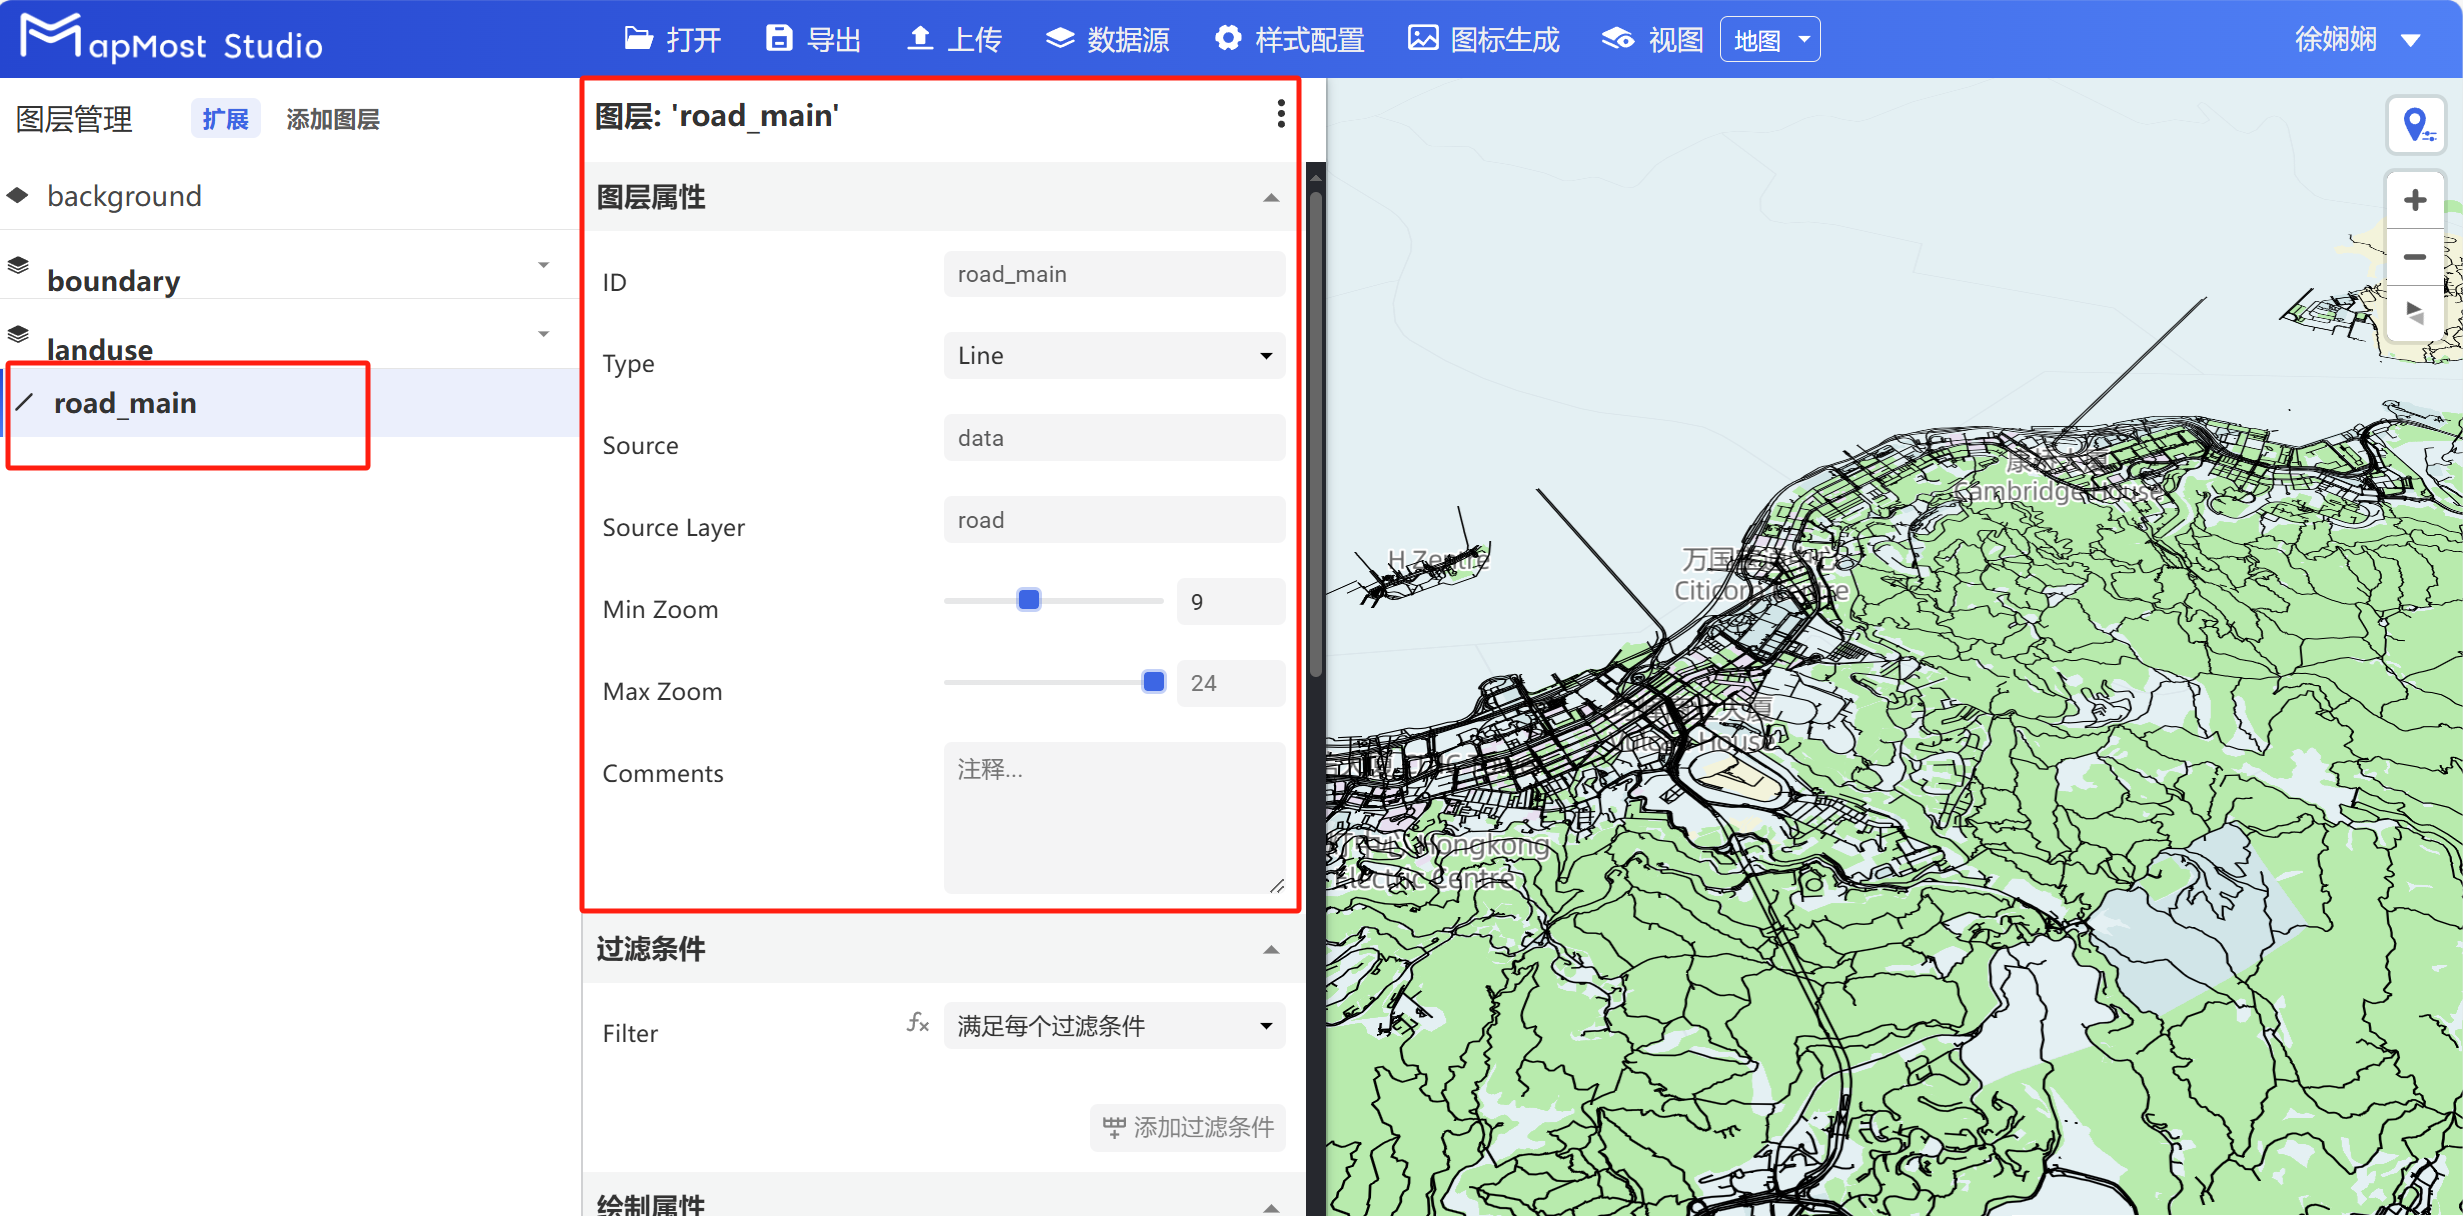
- Click the "Add Layer" button to add a road layer, customize the "ID" to "road_main", select "Line" for "Type", select "data" for "Source", select "road" for "SourceLayer", and modify the display level;
5.4.2. Add filter conditions
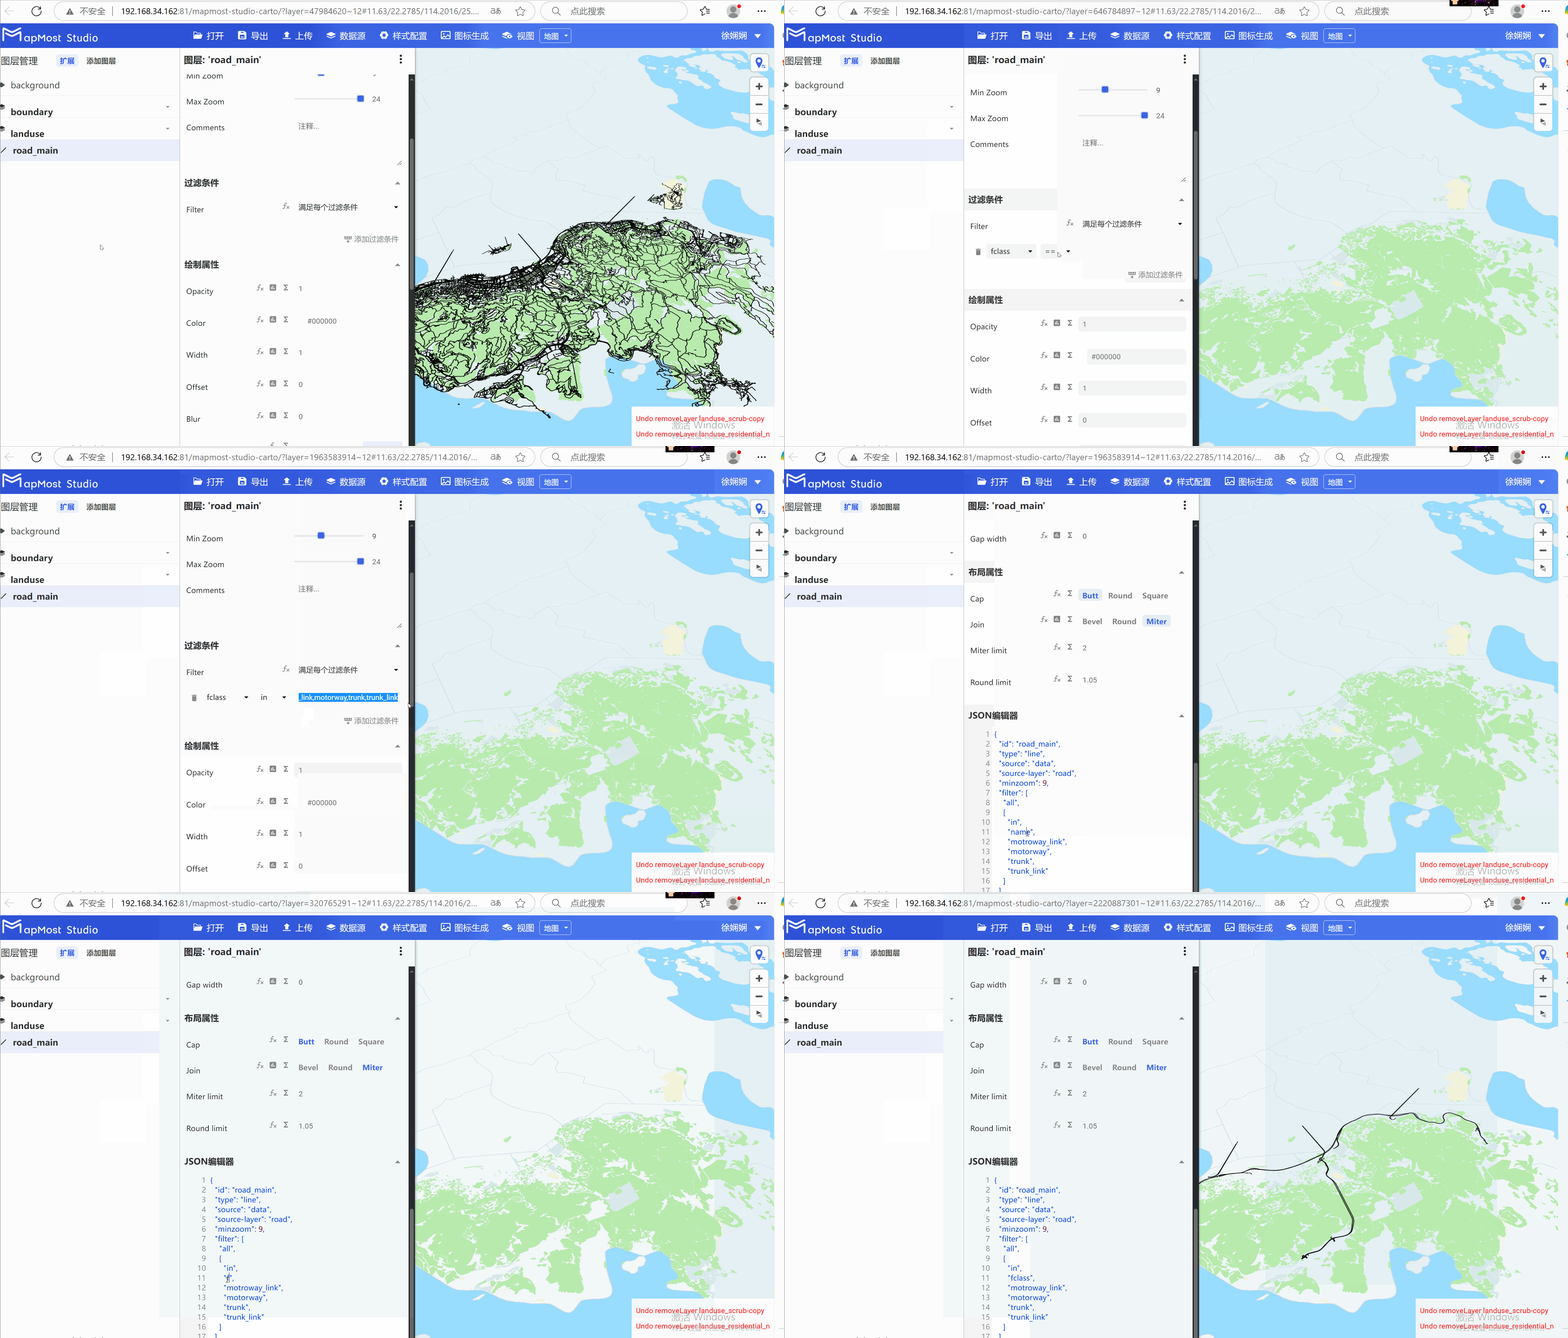
- Select the "road_main" layer, and in the "Filter Conditions" module, filter the "motorway_link", "motorway", "trunk", and "trunk_link" data in the "fclass" field;
5.4.3. Configure the "Drawing Properties" module
- Select the "road_main" layer, and in the "Drawing Properties" module and the "Layout Properties" module, change the line color, line width, line connection point method and other parameters;

5.4.4. Copy the "road_main" layer and create stroke lines
- Copy the "road_main" layer, change the ID, color, line width and other information to create a road stroke effect (pay attention to adjusting the layer order);
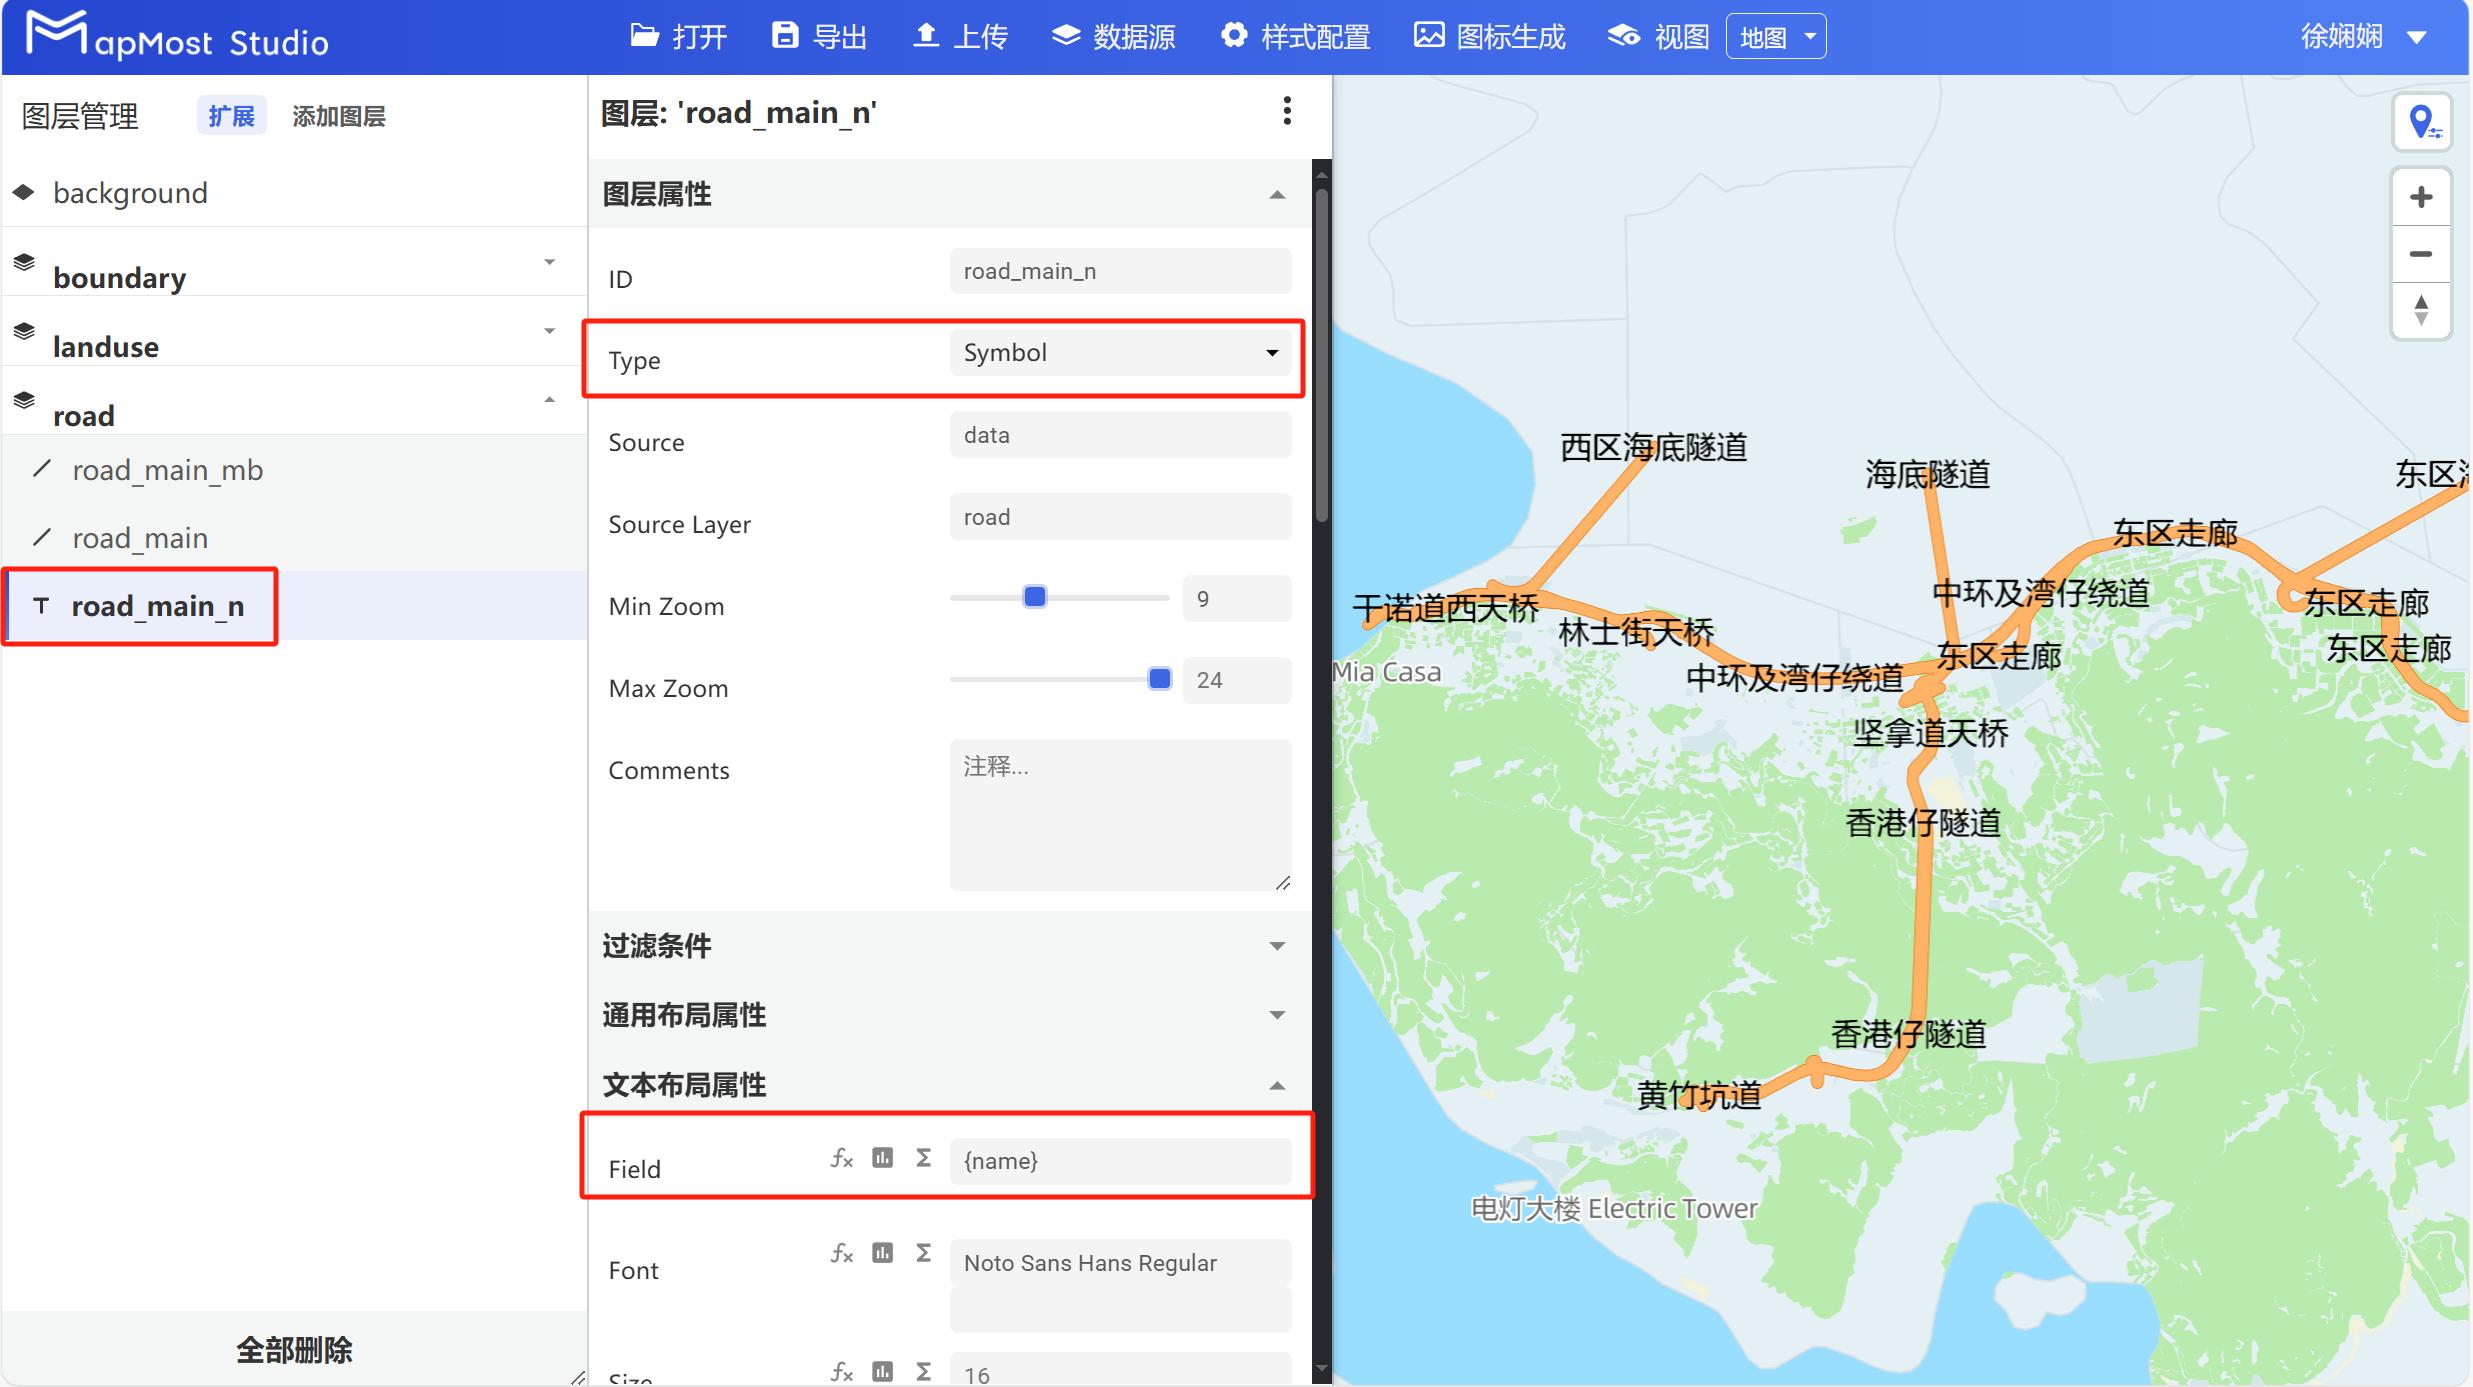
5.4.5. Duplicate the "road_main" layer and display the road name
- Copy the "road_main" layer, select "Symbol" for "Type", and call the road name field in the "Text Layout Properties" module (note to adjust the layer order);
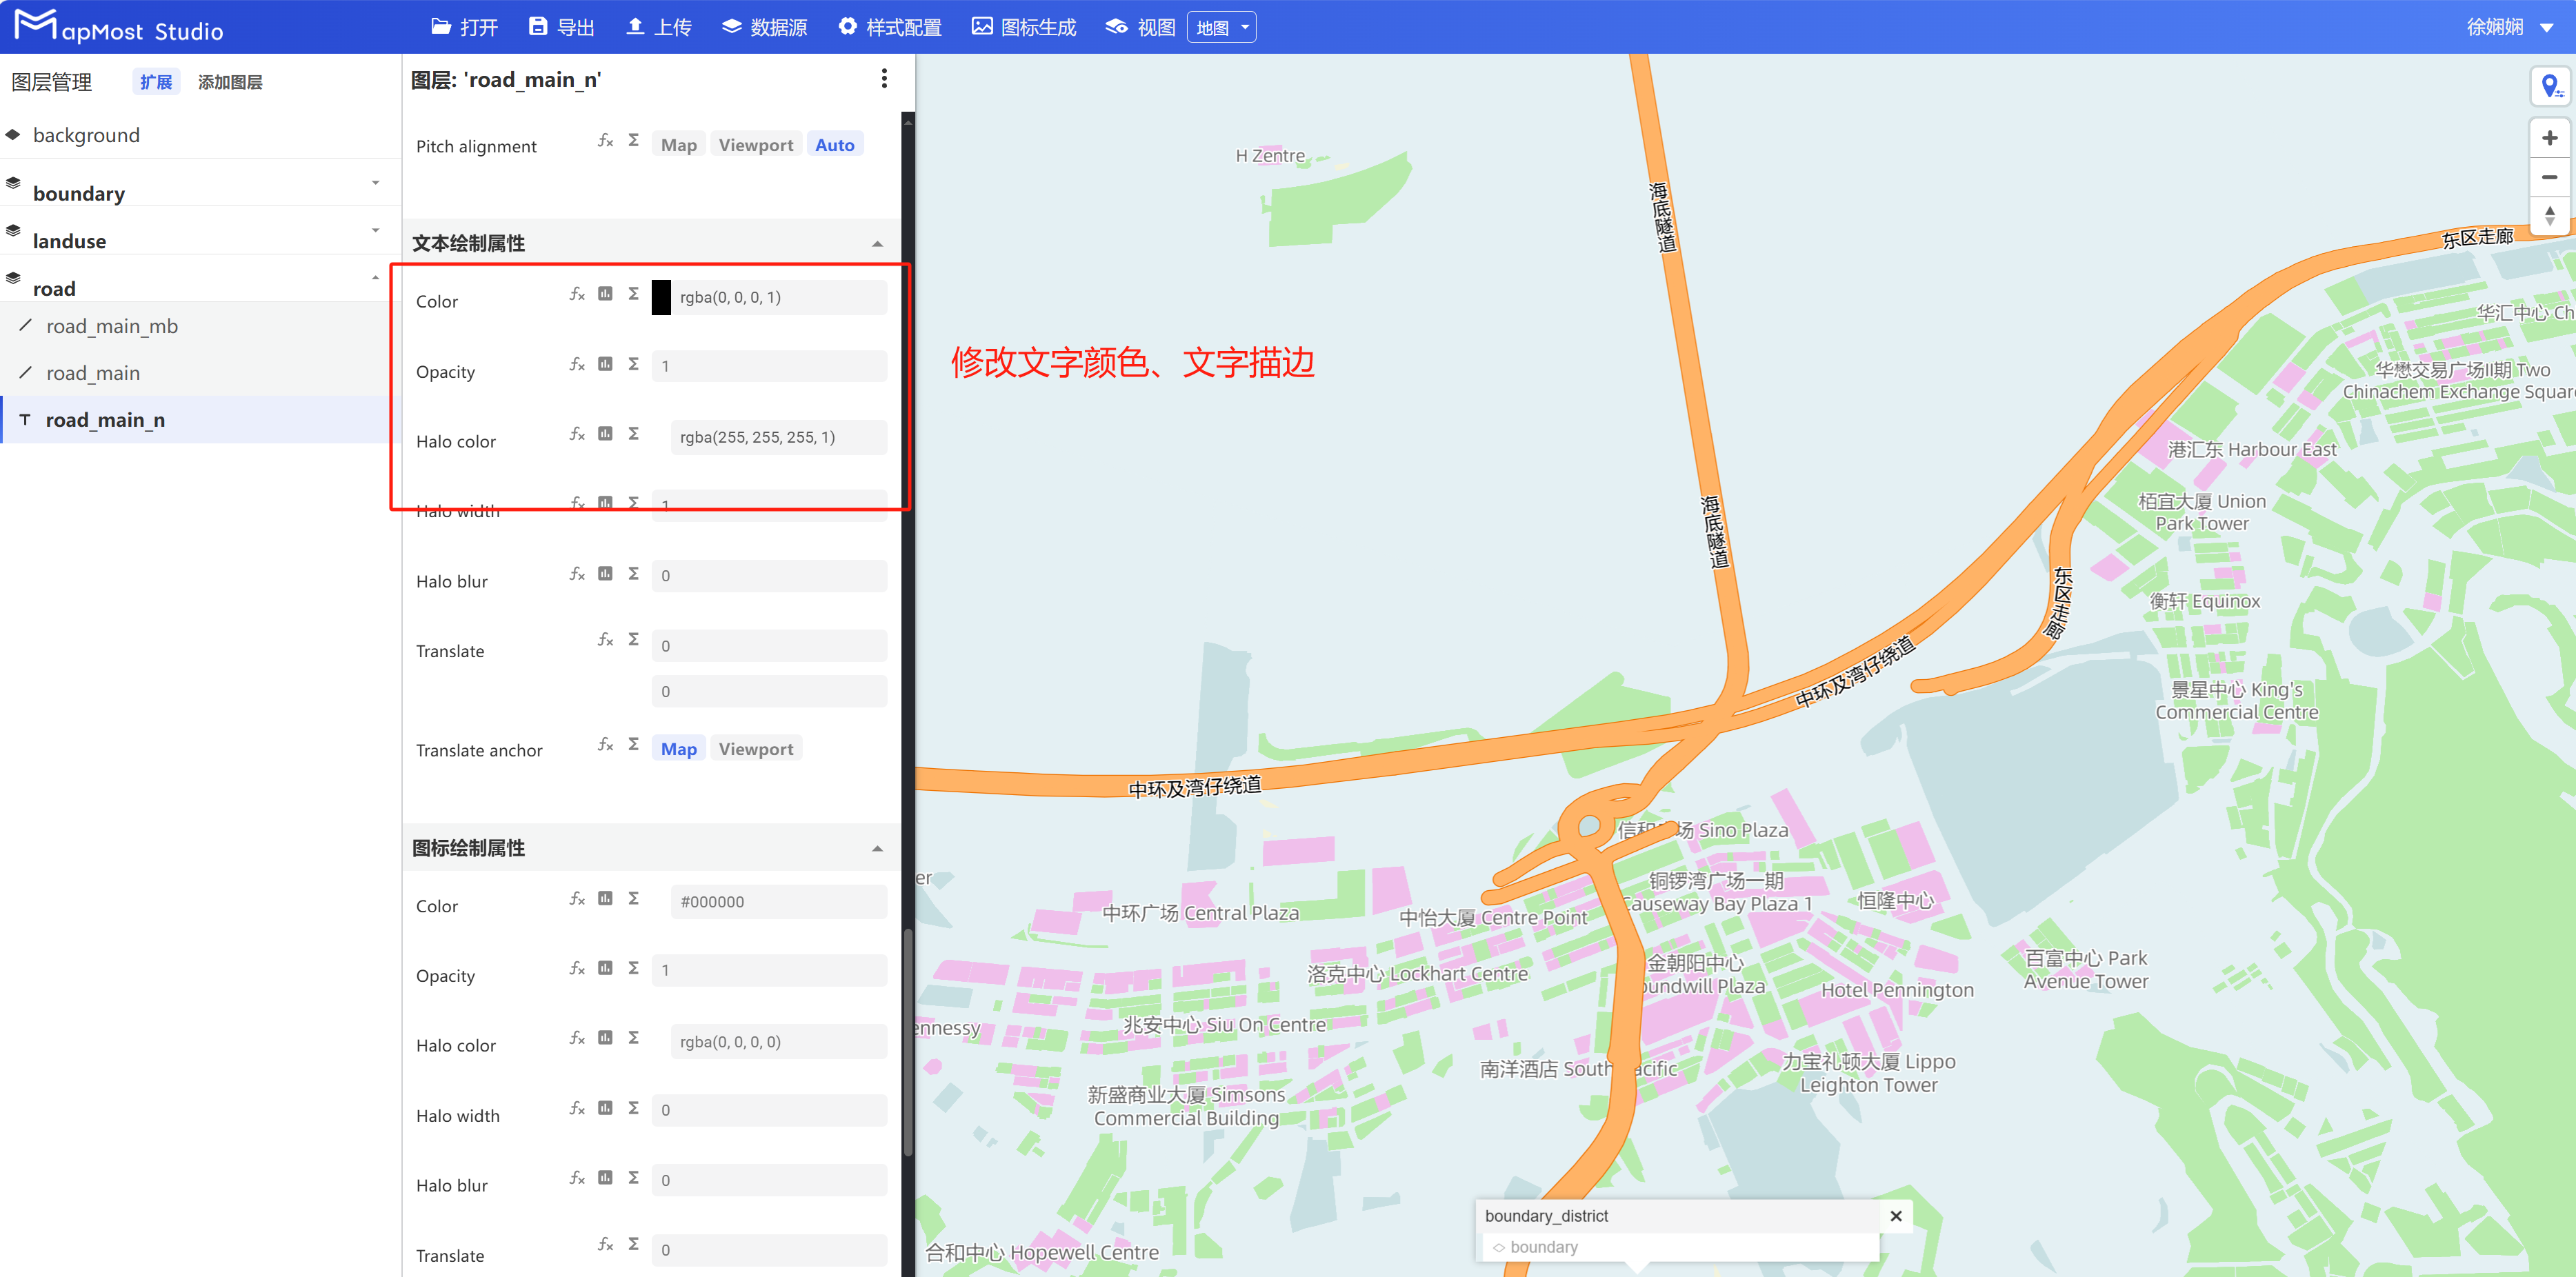
5.4.6. Configure the "General Layout Properties" module
- Select the "road_main_n" layer and set the text direction, font size, rotation method, font color, stroke and other information in the "General Layout Properties";

5.4.7. Enrich map styles
- Refer to steps 6.4.1-6.4.6 to display more road route data and improve the richness of the scene (pay attention to adjusting the layer order);
5.5. Add water layer and set layer properties
5.5.1. Configure the "Add Layer" pop-up window
- Click the "Add Layer" button to add a water layer, customize the "ID" to "water_big", select "Fill" for "Type", select "data" for "Source", select "water" for "SourceLayer", and modify the display level;

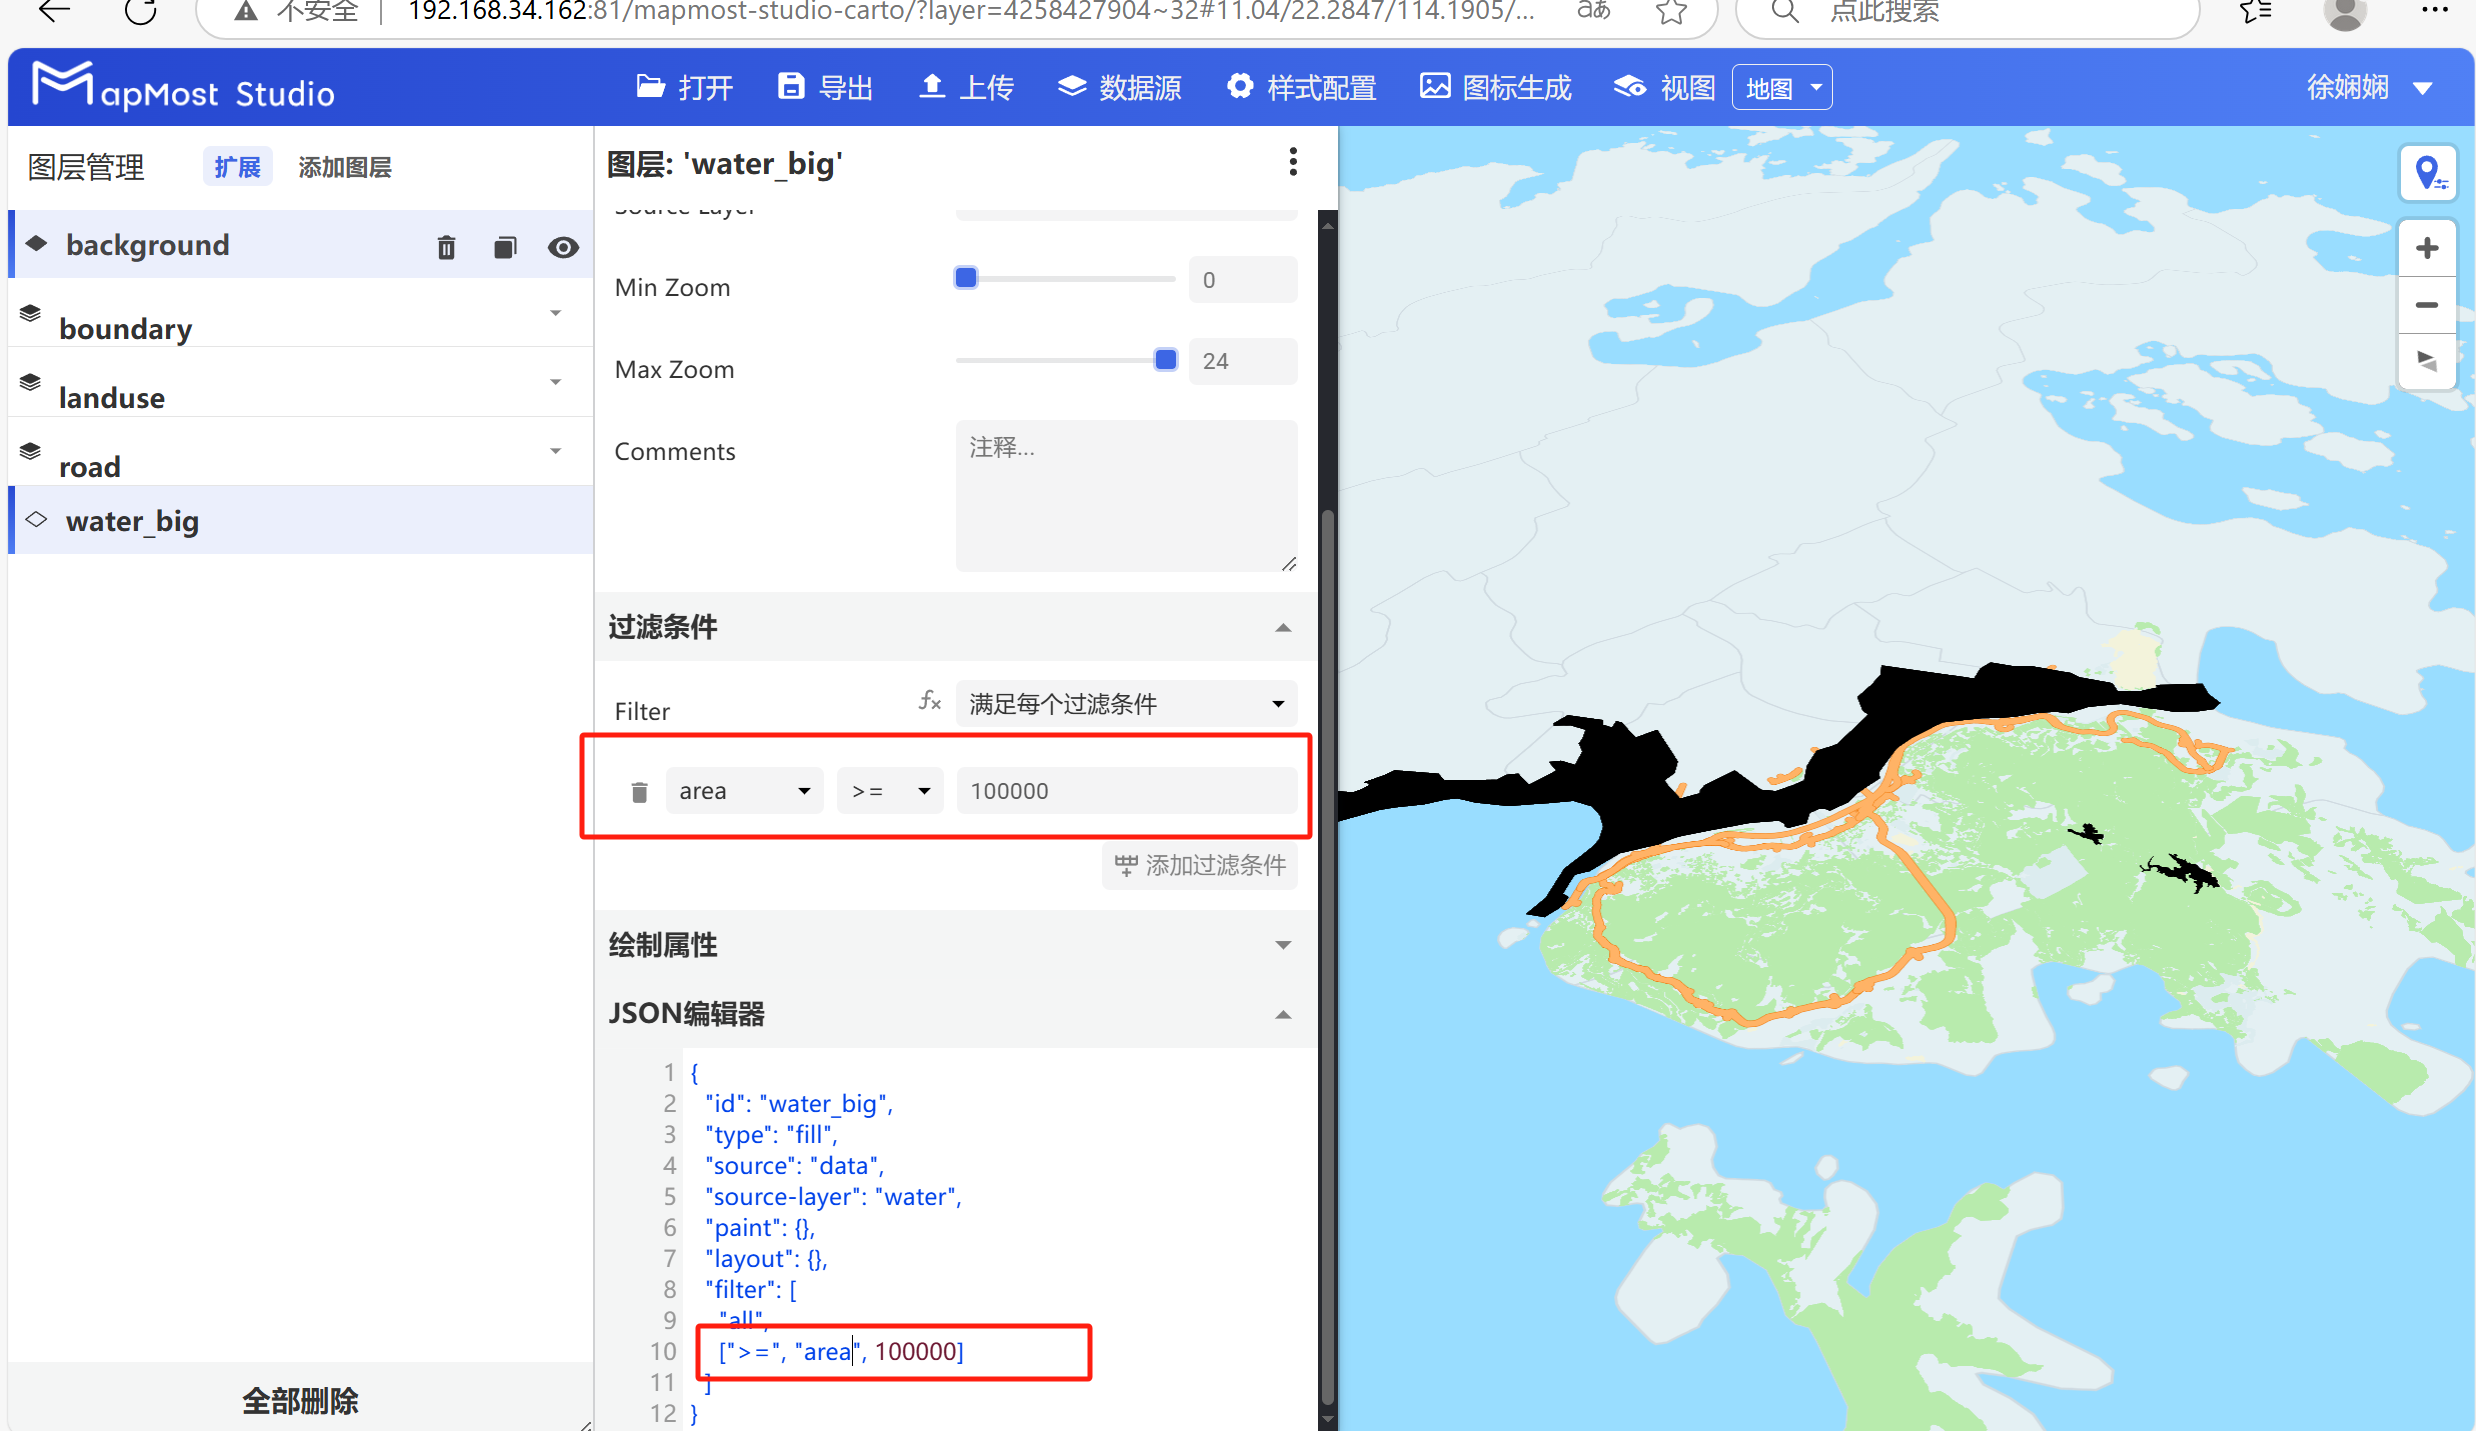
5.5.2. Add filter conditions
- Select the "water_big" layer, and in the "Filter Conditions" module, filter out the area data of "area>=1000000";
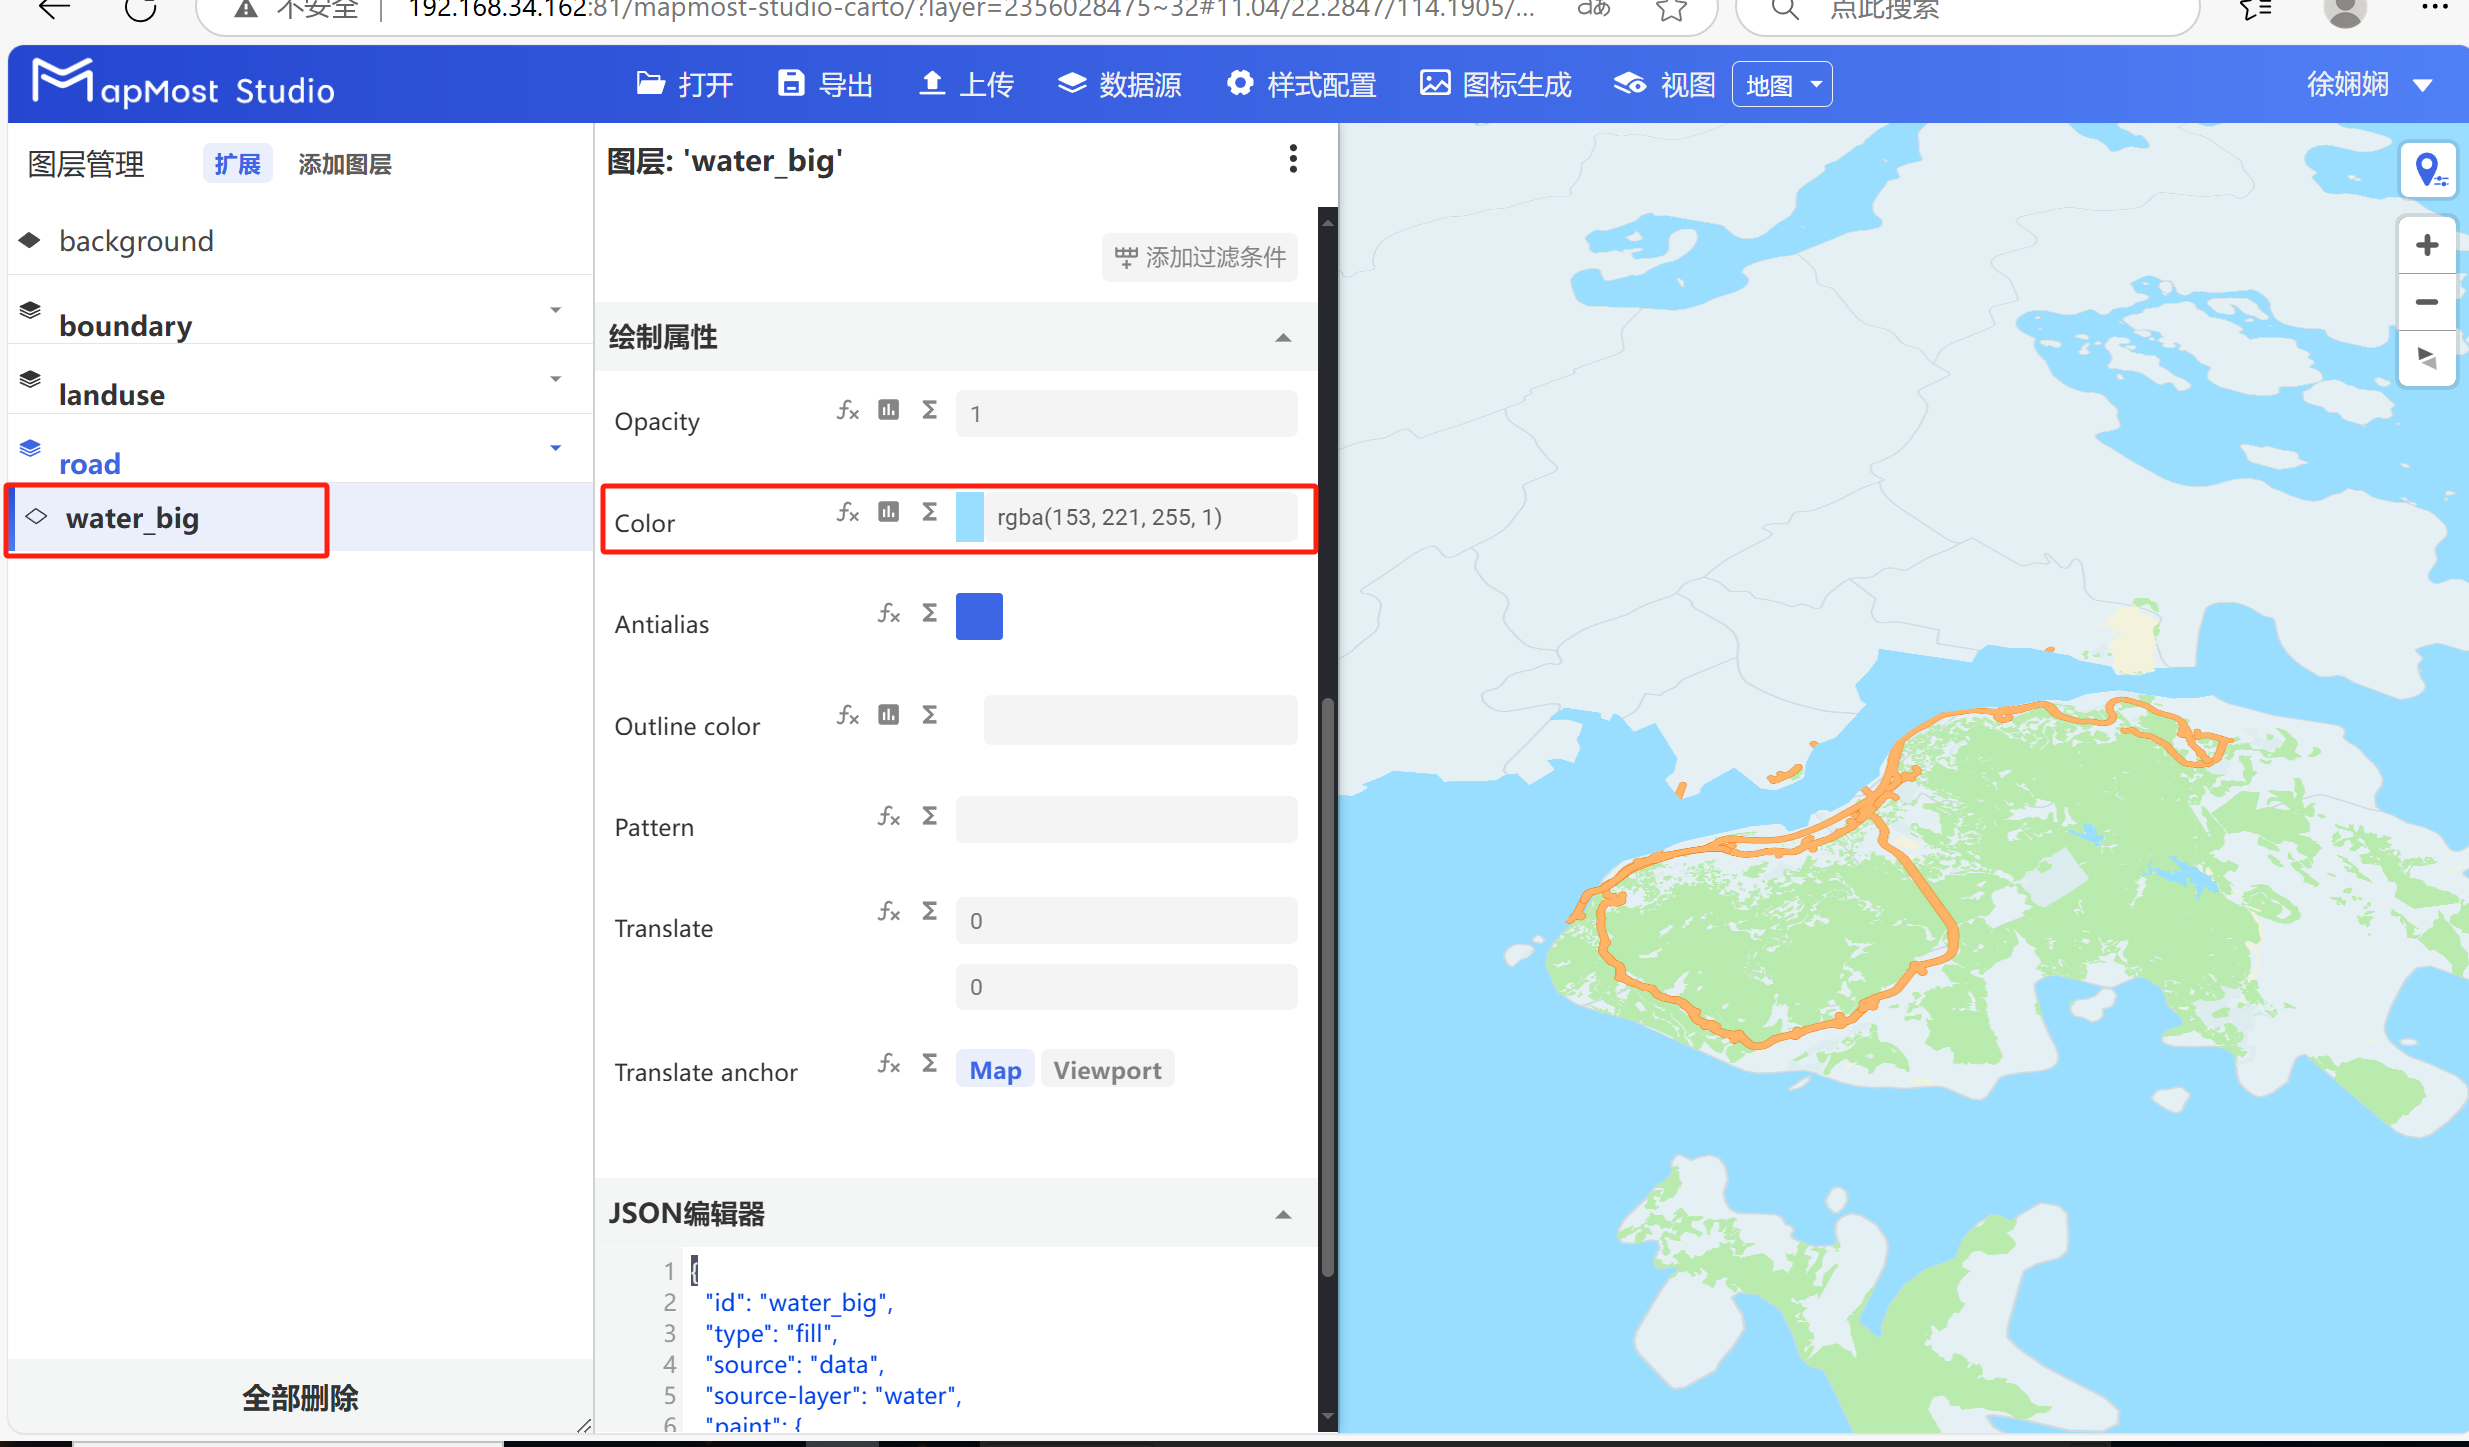
5.5.3. Configuring the "Drawing Properties" module
- Select the "water_big" layer and change the surface data color in the "Drawing Properties" module;
5.5.4. Duplicate the "water_big" layer to display large lake data
- Copy the "water_big" layer, change the ID to "water_small", modify the display level, and filter out the area data of "area<1000000";

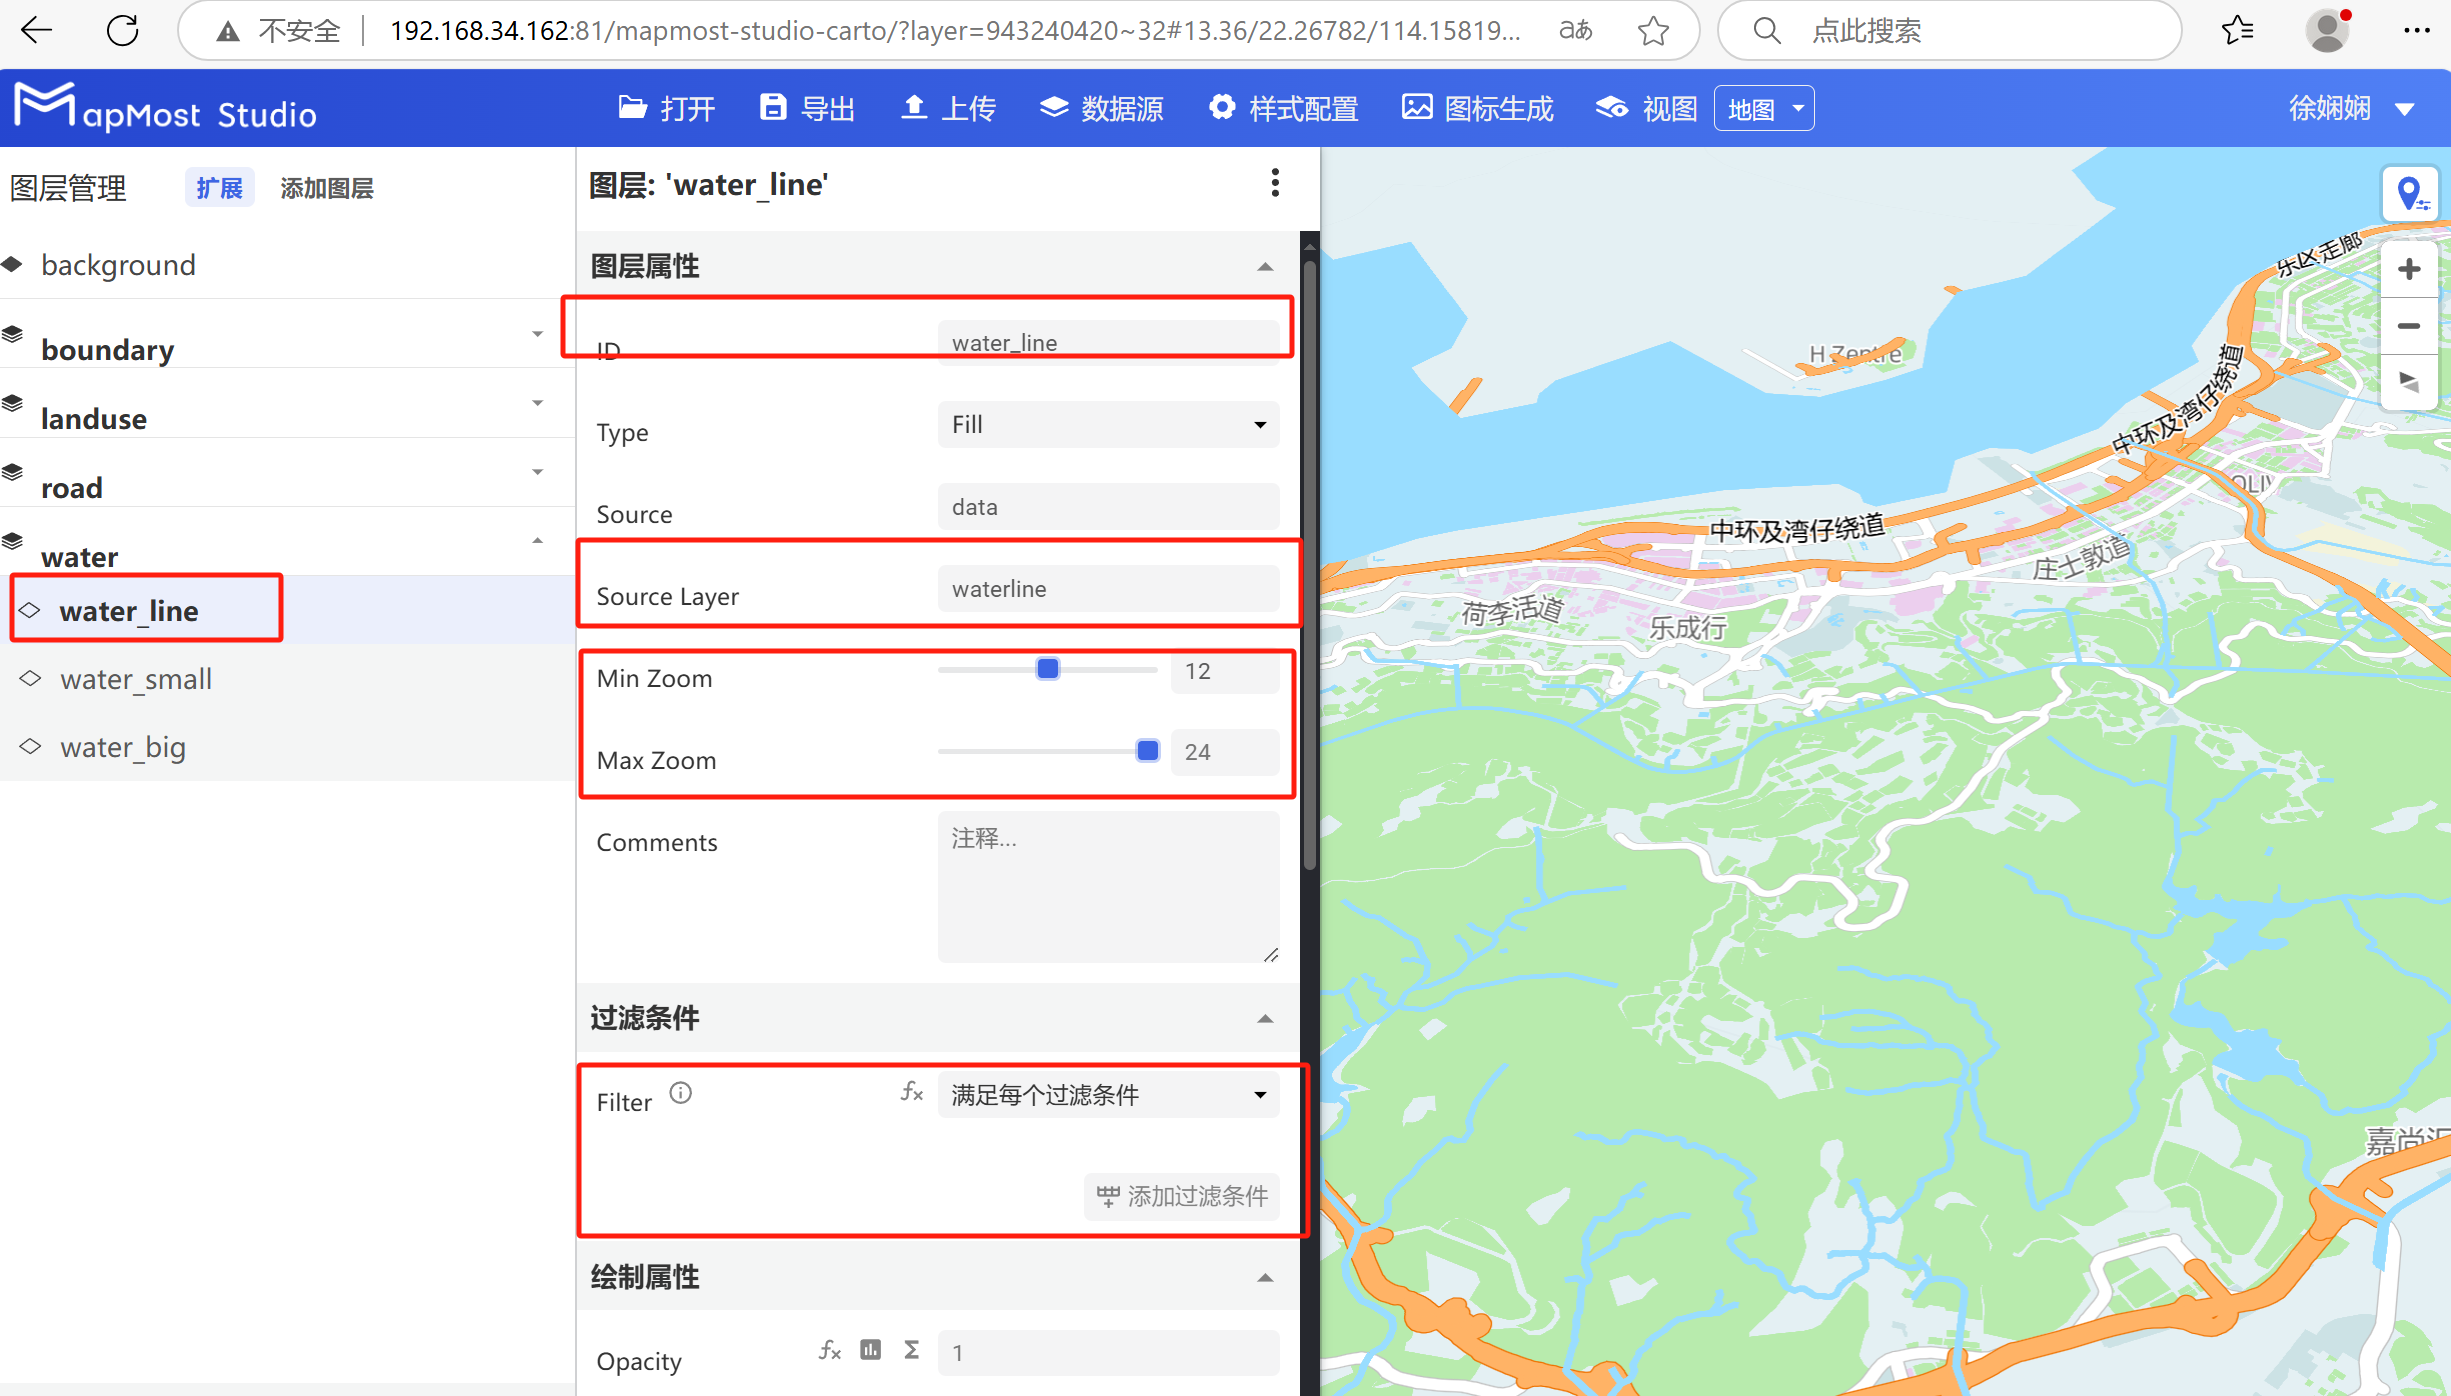
5.5.5. Copy the "water_big" layer to display water system data
- Copy the "water_big" layer, change the ID to "water_line", modify the display level, select "waterline" for "SourceLayer", and delete the filter conditions;
5.6. Add building layer and set layer properties
5.6.1. Configure the "Add Layer" pop-up window
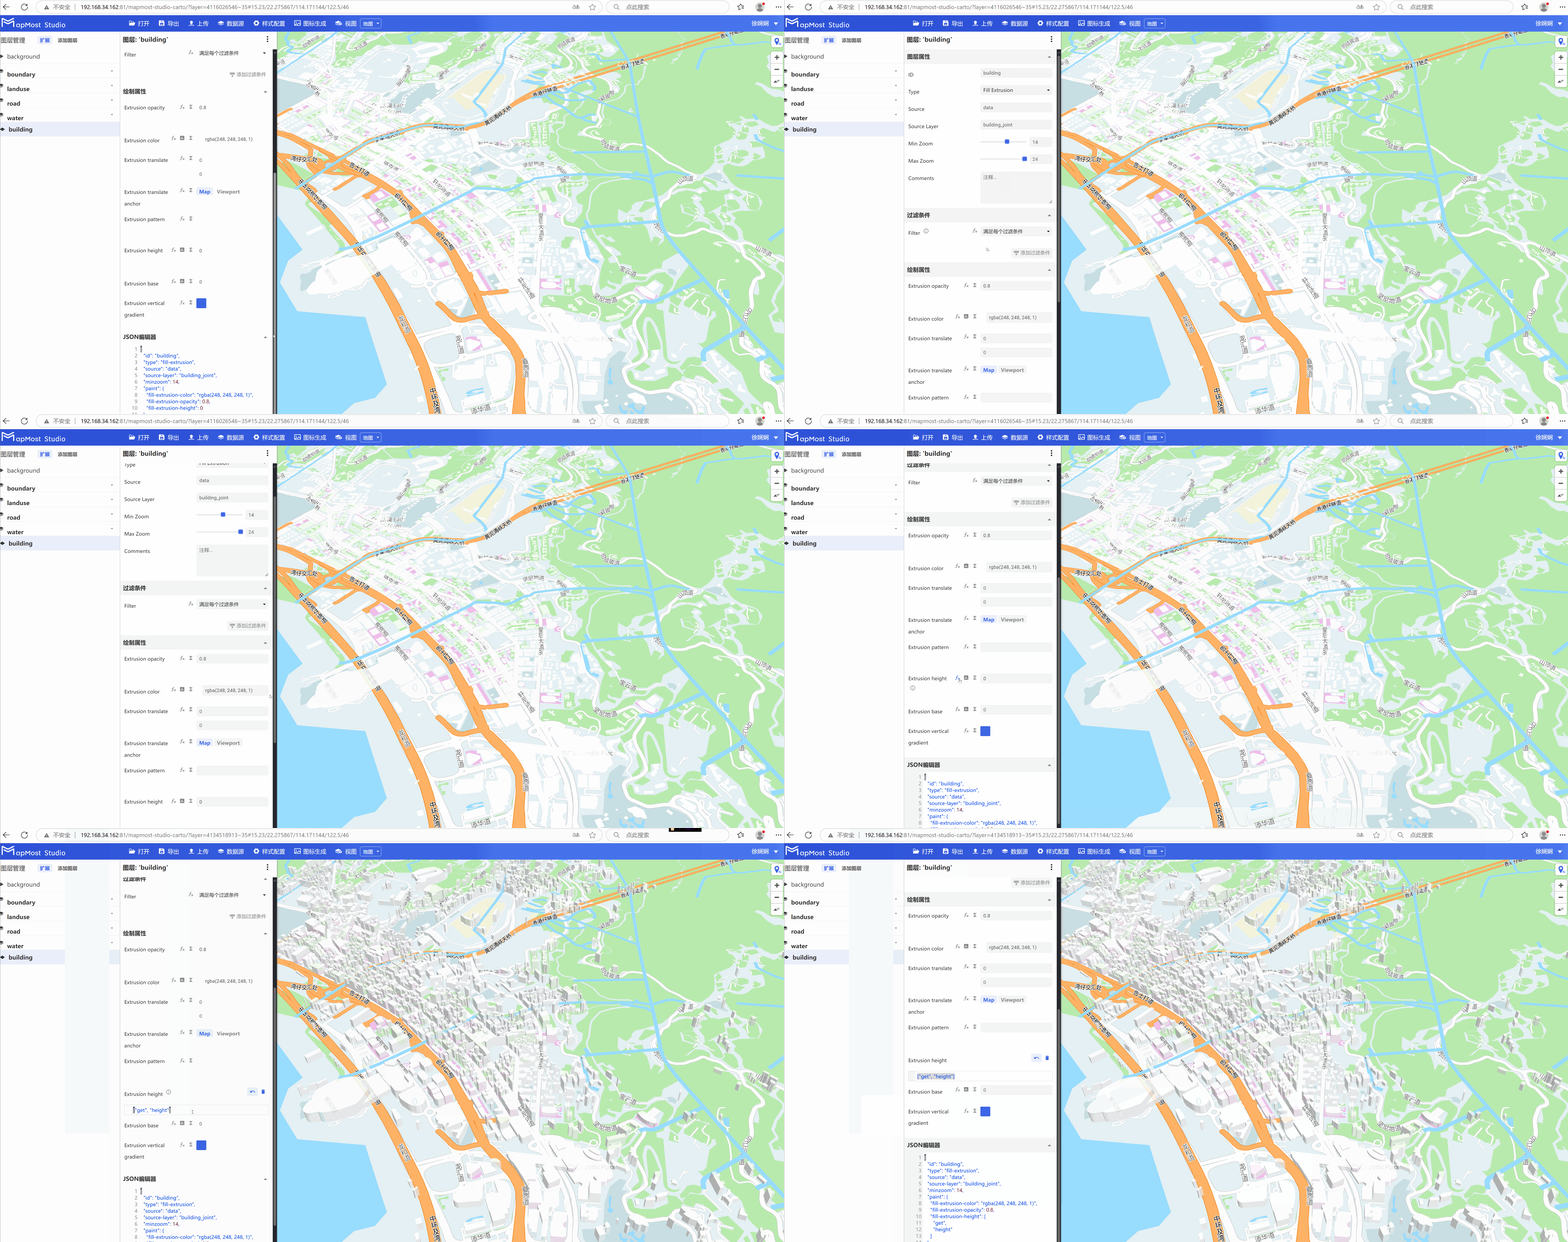
- Click the "Add Layer" button to add a building layer, customize the "ID" to "building", select "FillExtrusion" for "Type", select "data" for "Source", select "building_joint" for "SourceLayer", and modify the display level;

5.6.2. Configuring the "Drawing Properties" module
- Select the "building" layer, modify the building color and transparency in the "Drawing Properties" module, and in the "Extrusion height" parameter, enter "["get", "height"]" to obtain the building height;
5.7. Add point layer and set layer properties
5.7.1. Configure the "Add Layer" pop-up window
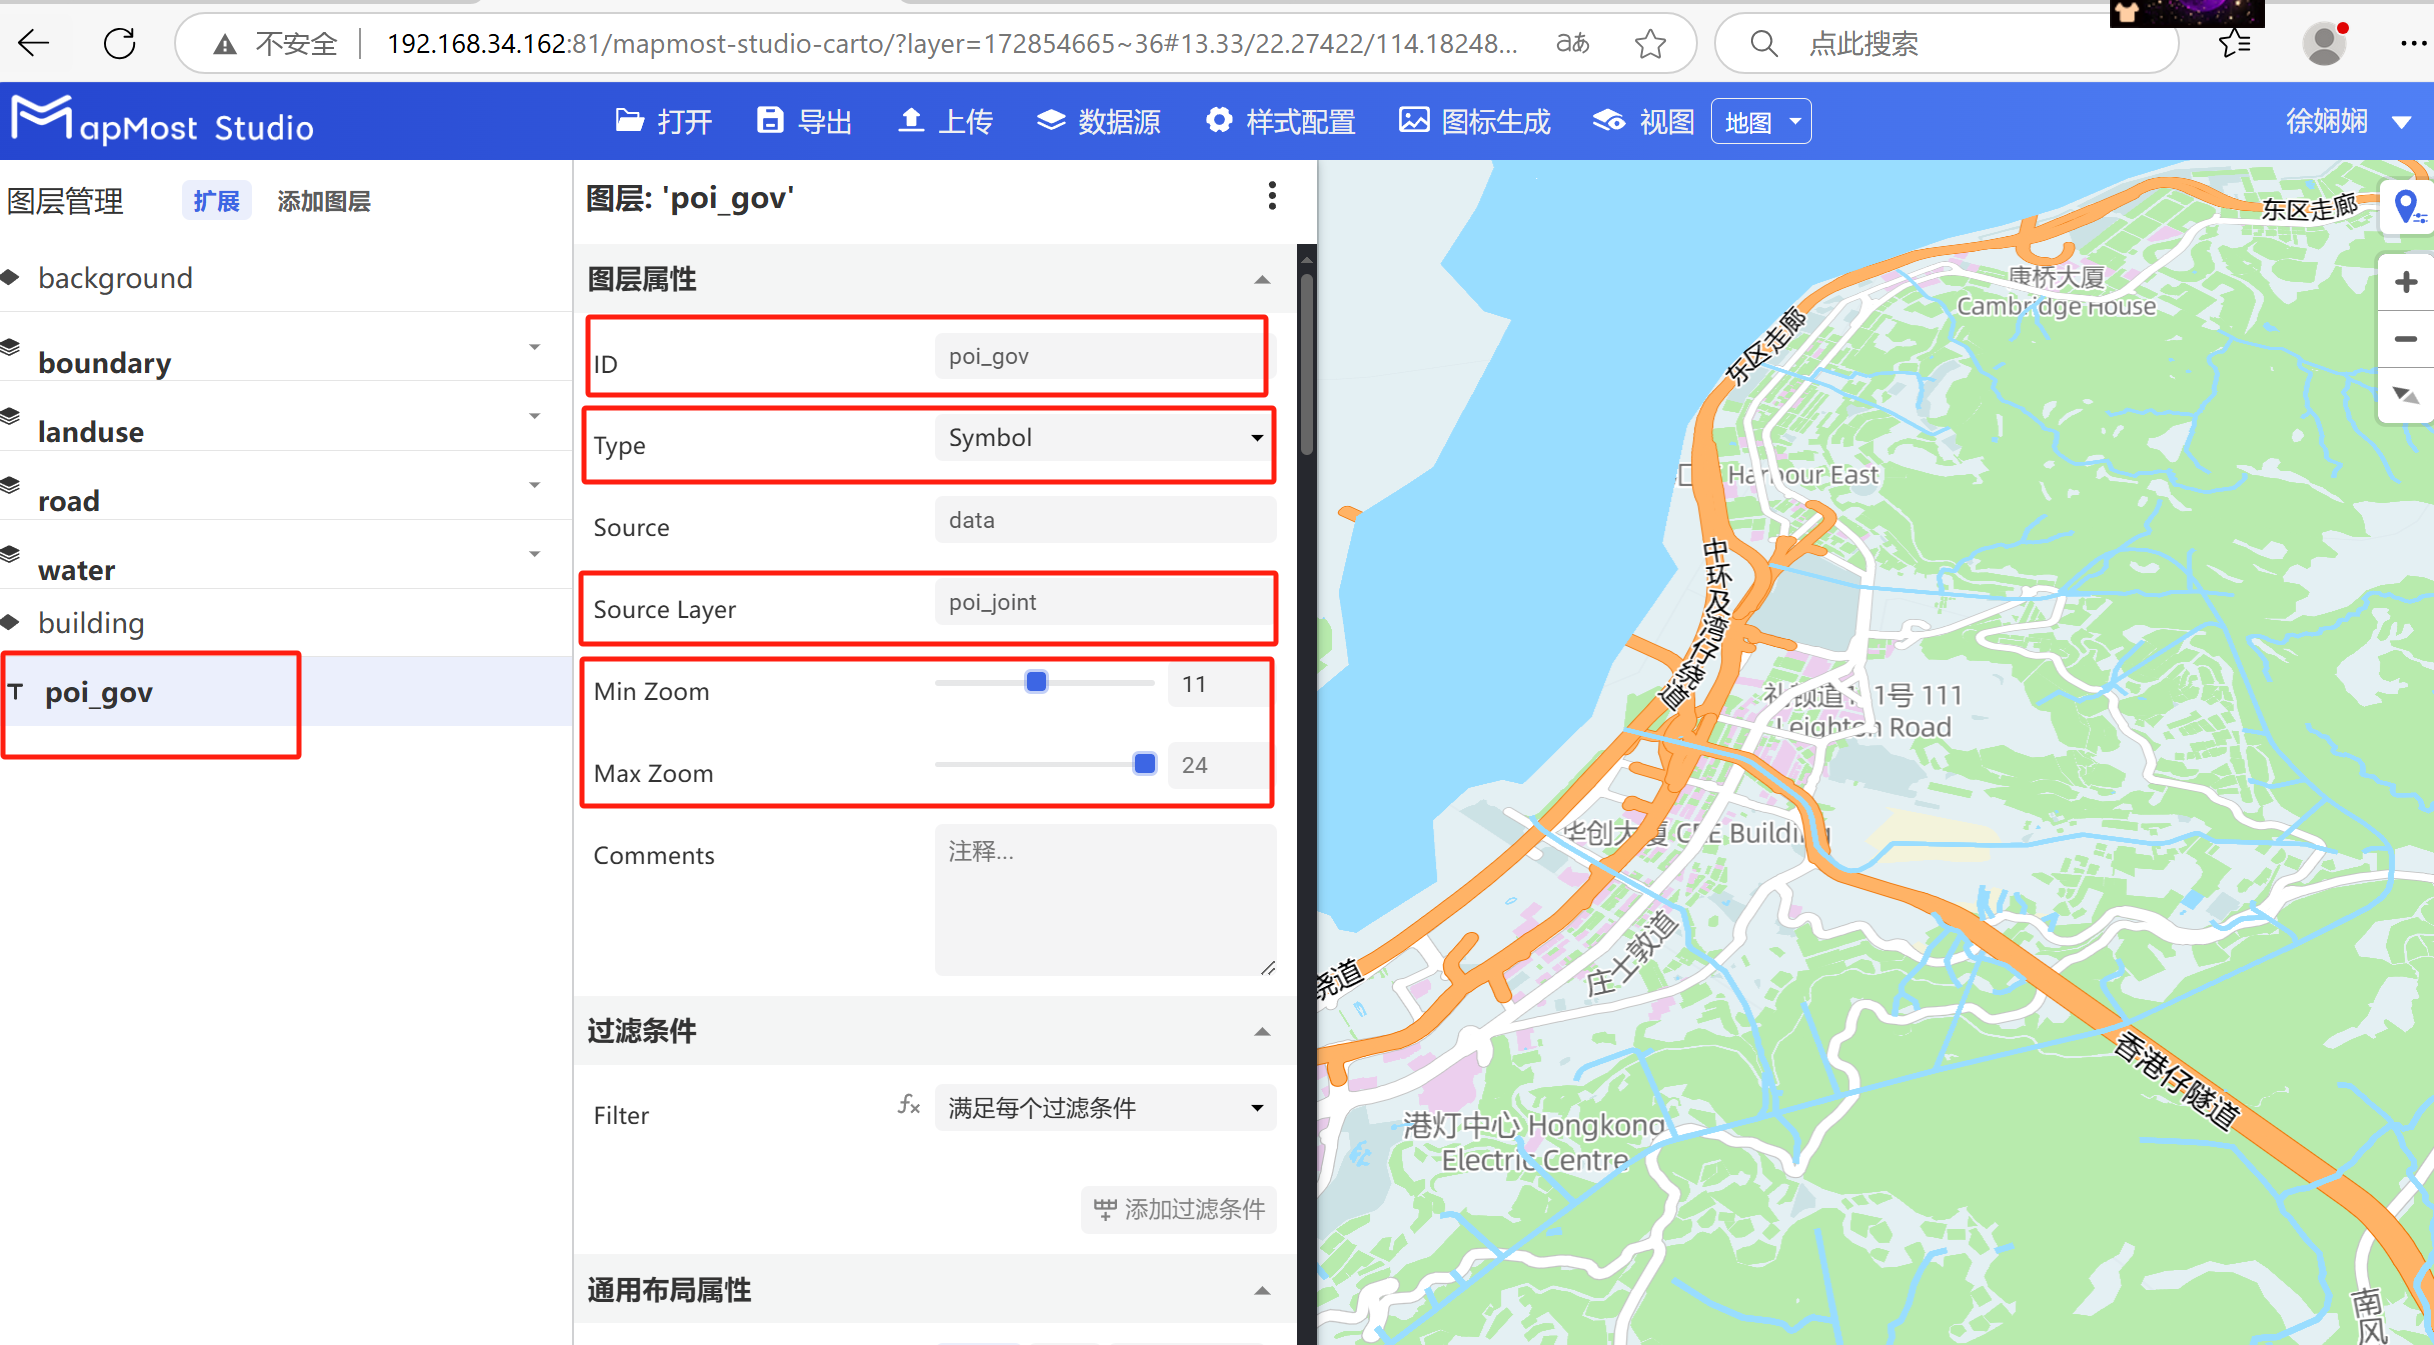
- Click the "Add Layer" button to add a point layer, customize the "ID" to "poi_gov", select "Symbol" for "Type", select "data" for "Source", select "poi_joint" for "SourceLayer", and modify the display level;
5.7.2. Add filter conditions
- Select the "poi_gov" layer, add filter conditions in the "Filter Conditions" module, and get the name field;

5.7.3. Add icon
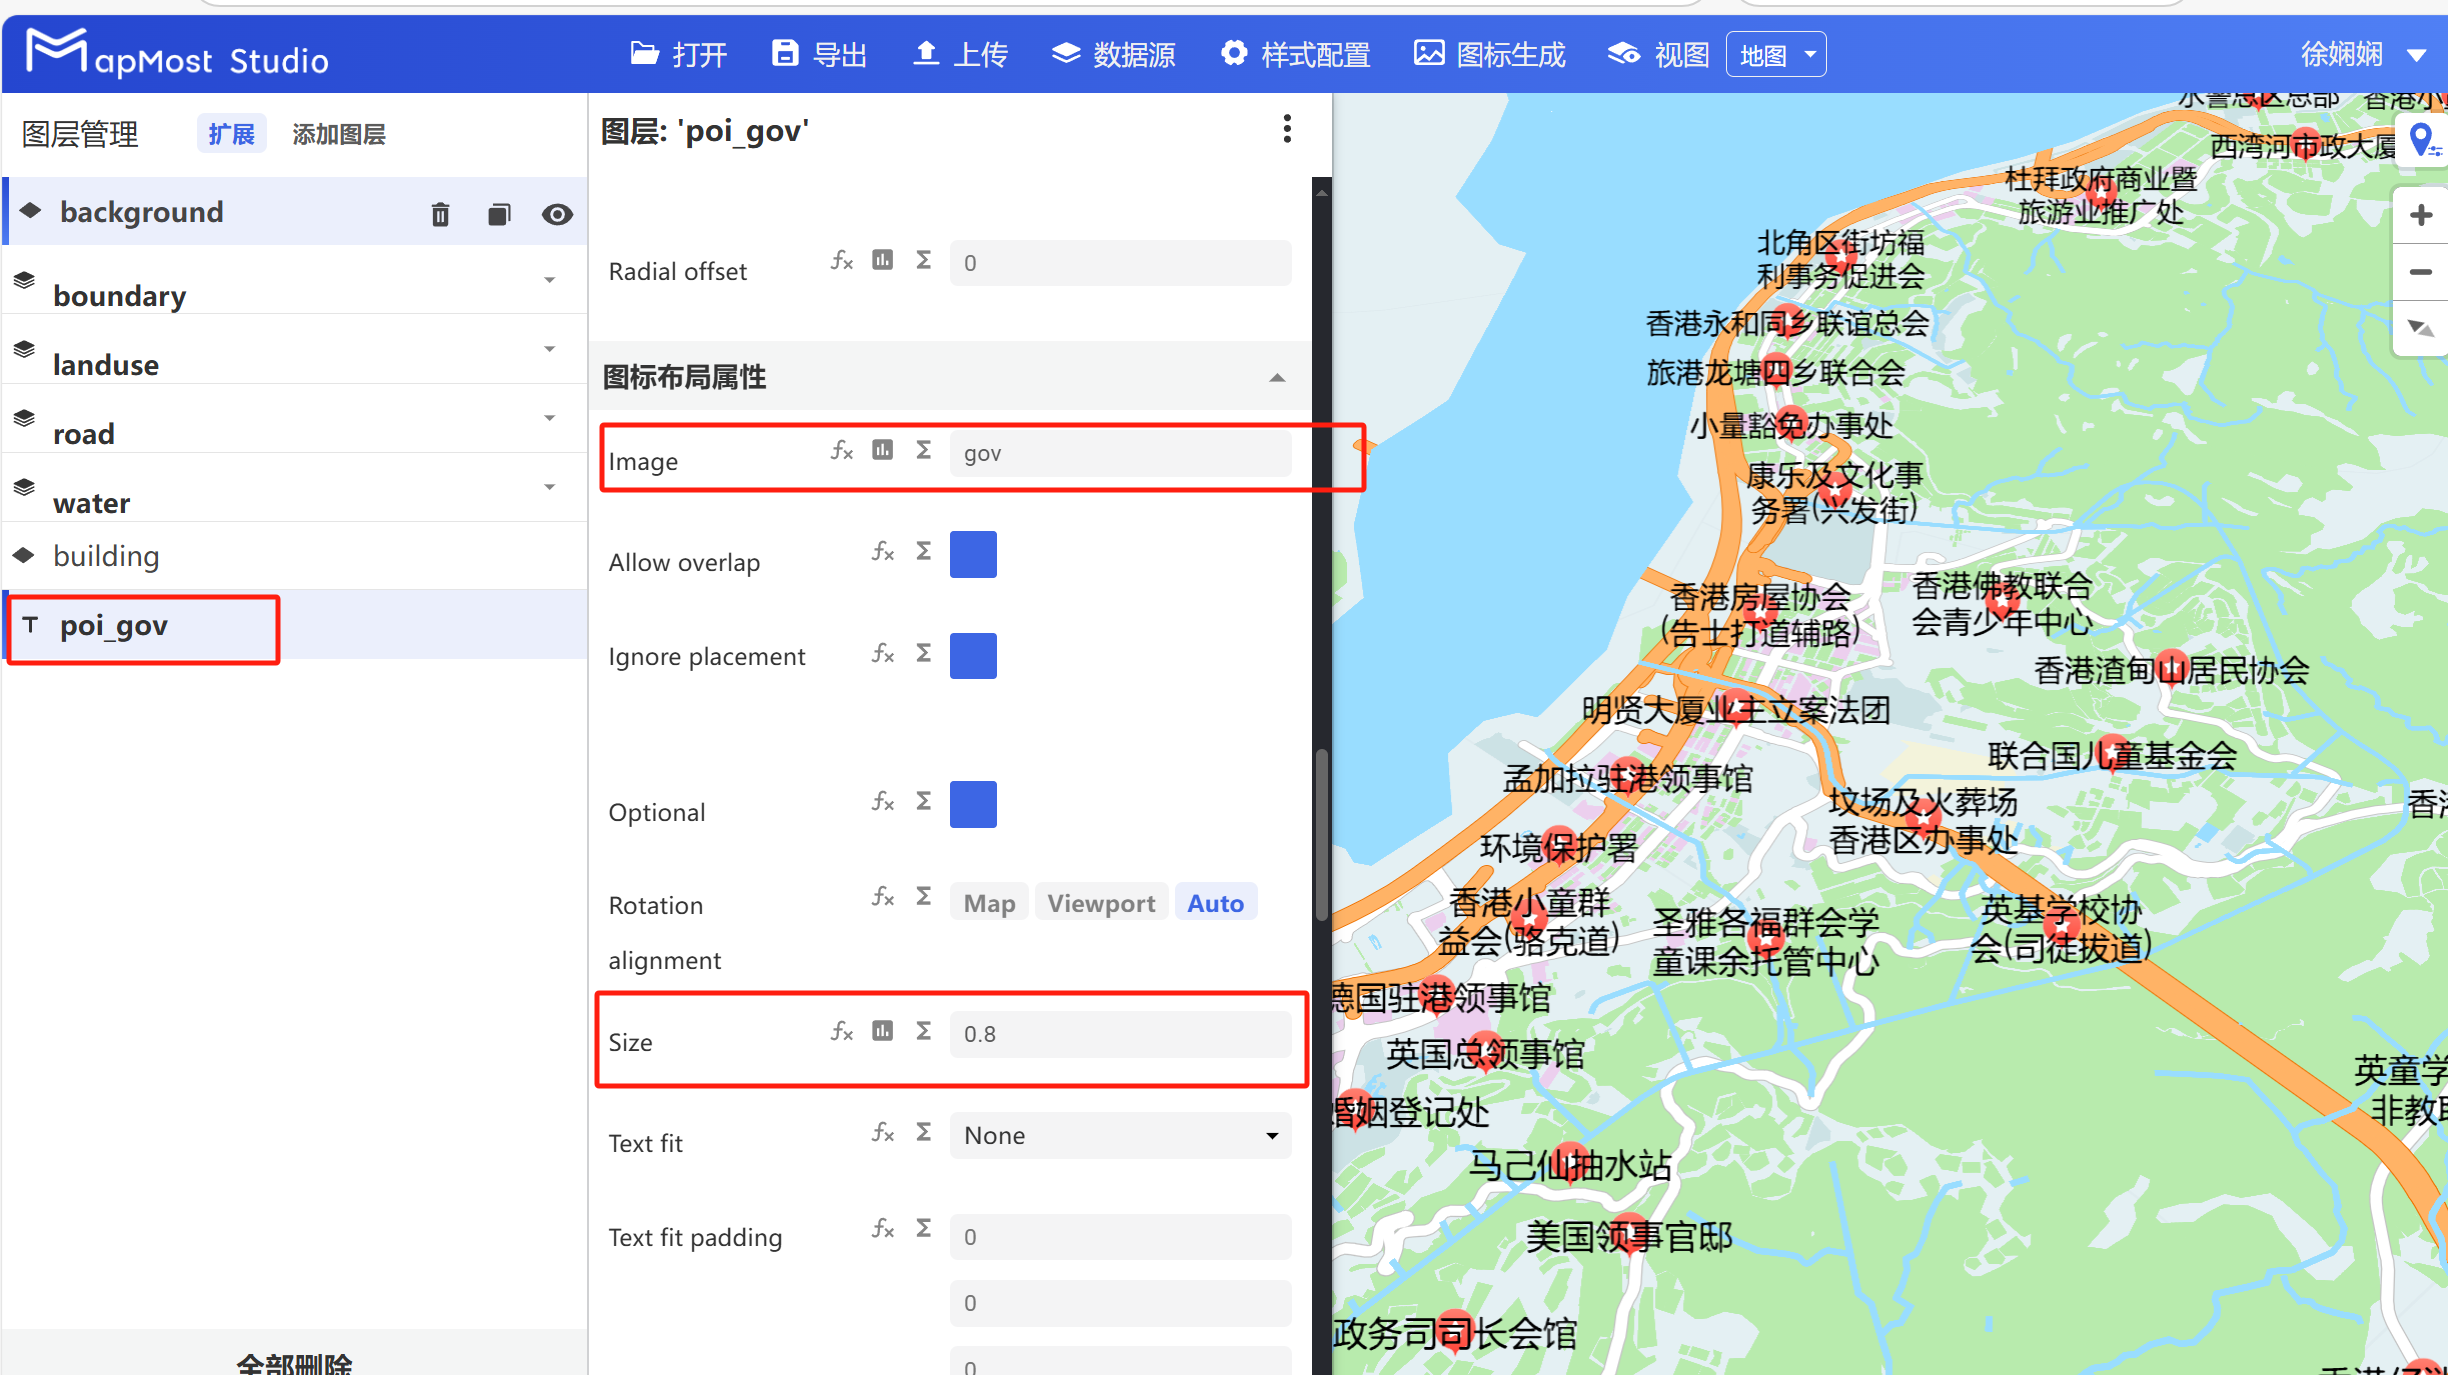
- Select the "poi_gov" layer, add an icon in the "Icon Layout Properties" module, and modify the icon size;
5.7.4. Configure the "Text Layout Properties" module
- Select the "poi_gov" layer, and in the "Text Layout Properties" module, modify the text font, text line width, text alignment, text offset distance, text color, text stroke and other information;
5.7.5. Configure the "Icon Layout Properties" module
- Select the "poi_gov" layer, and in the "Icon Layout Properties" module, modify the icon display density;
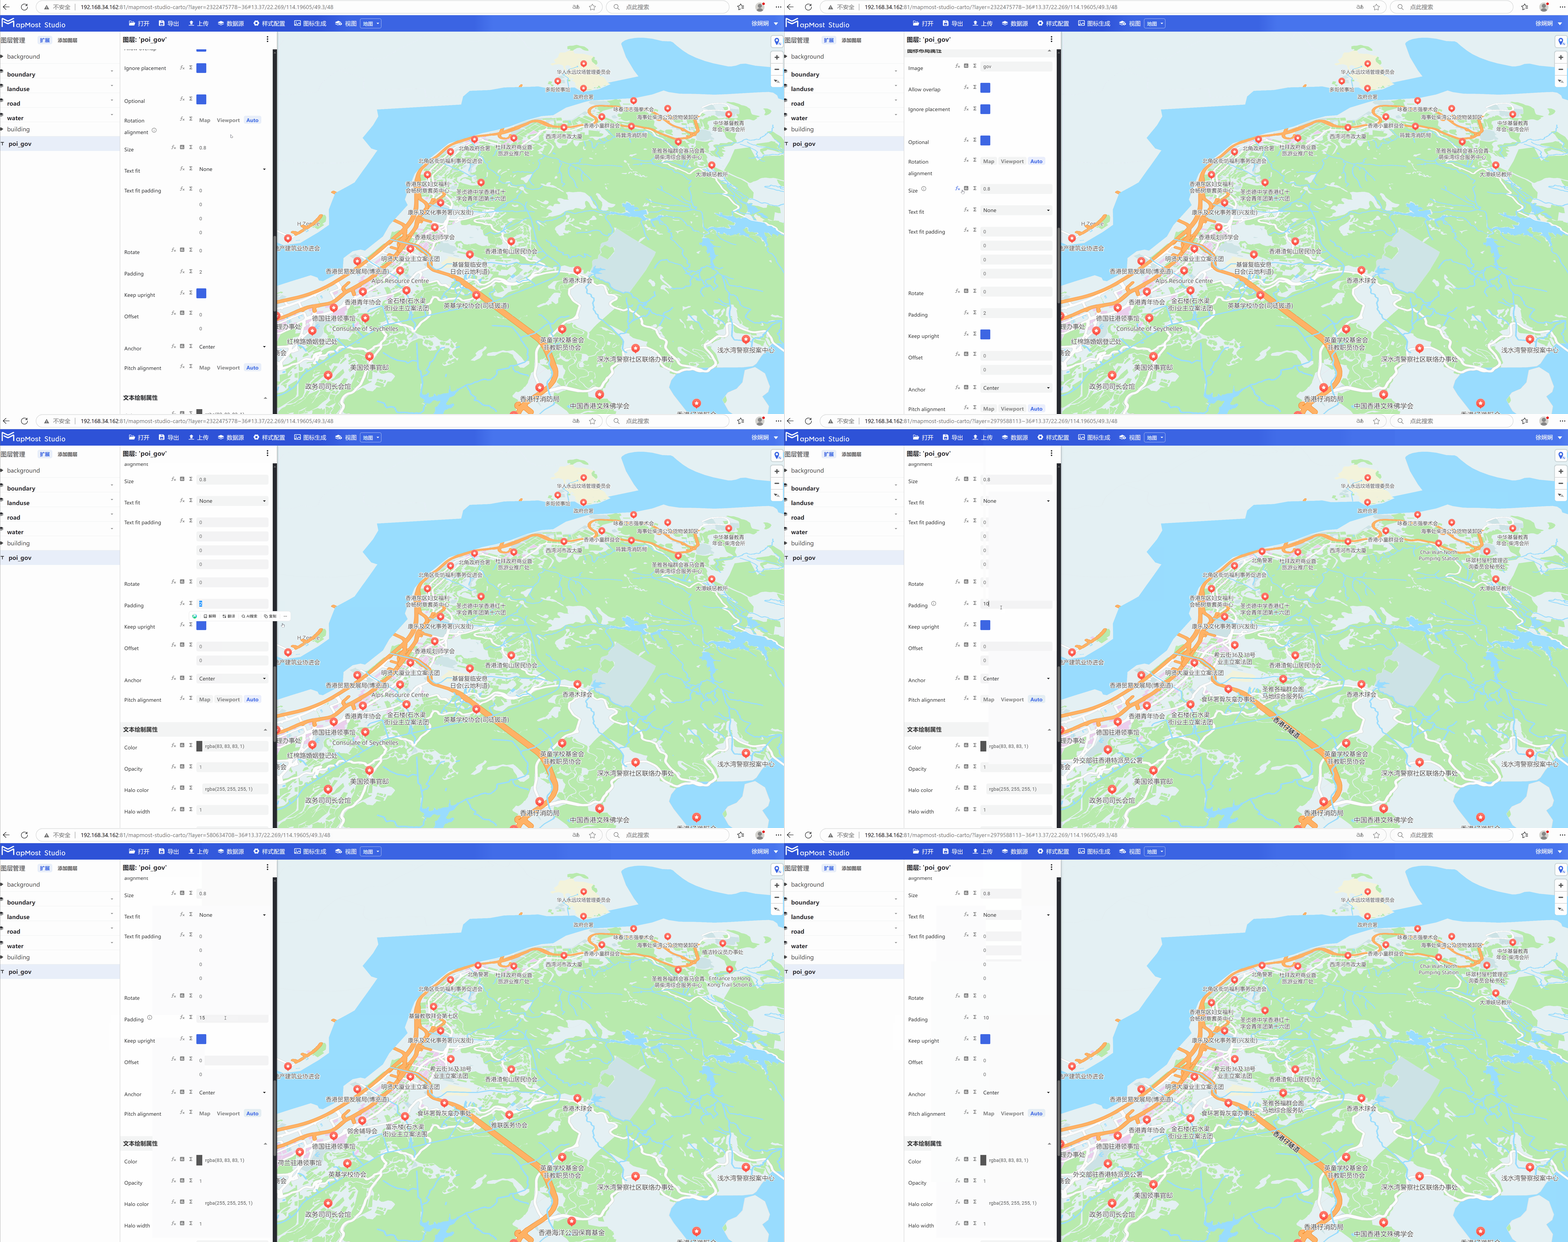
5.7.6. Enrich map styles
- Refer to steps 6.7.1-6.7.5 to display more point data and enrich the graphics style;
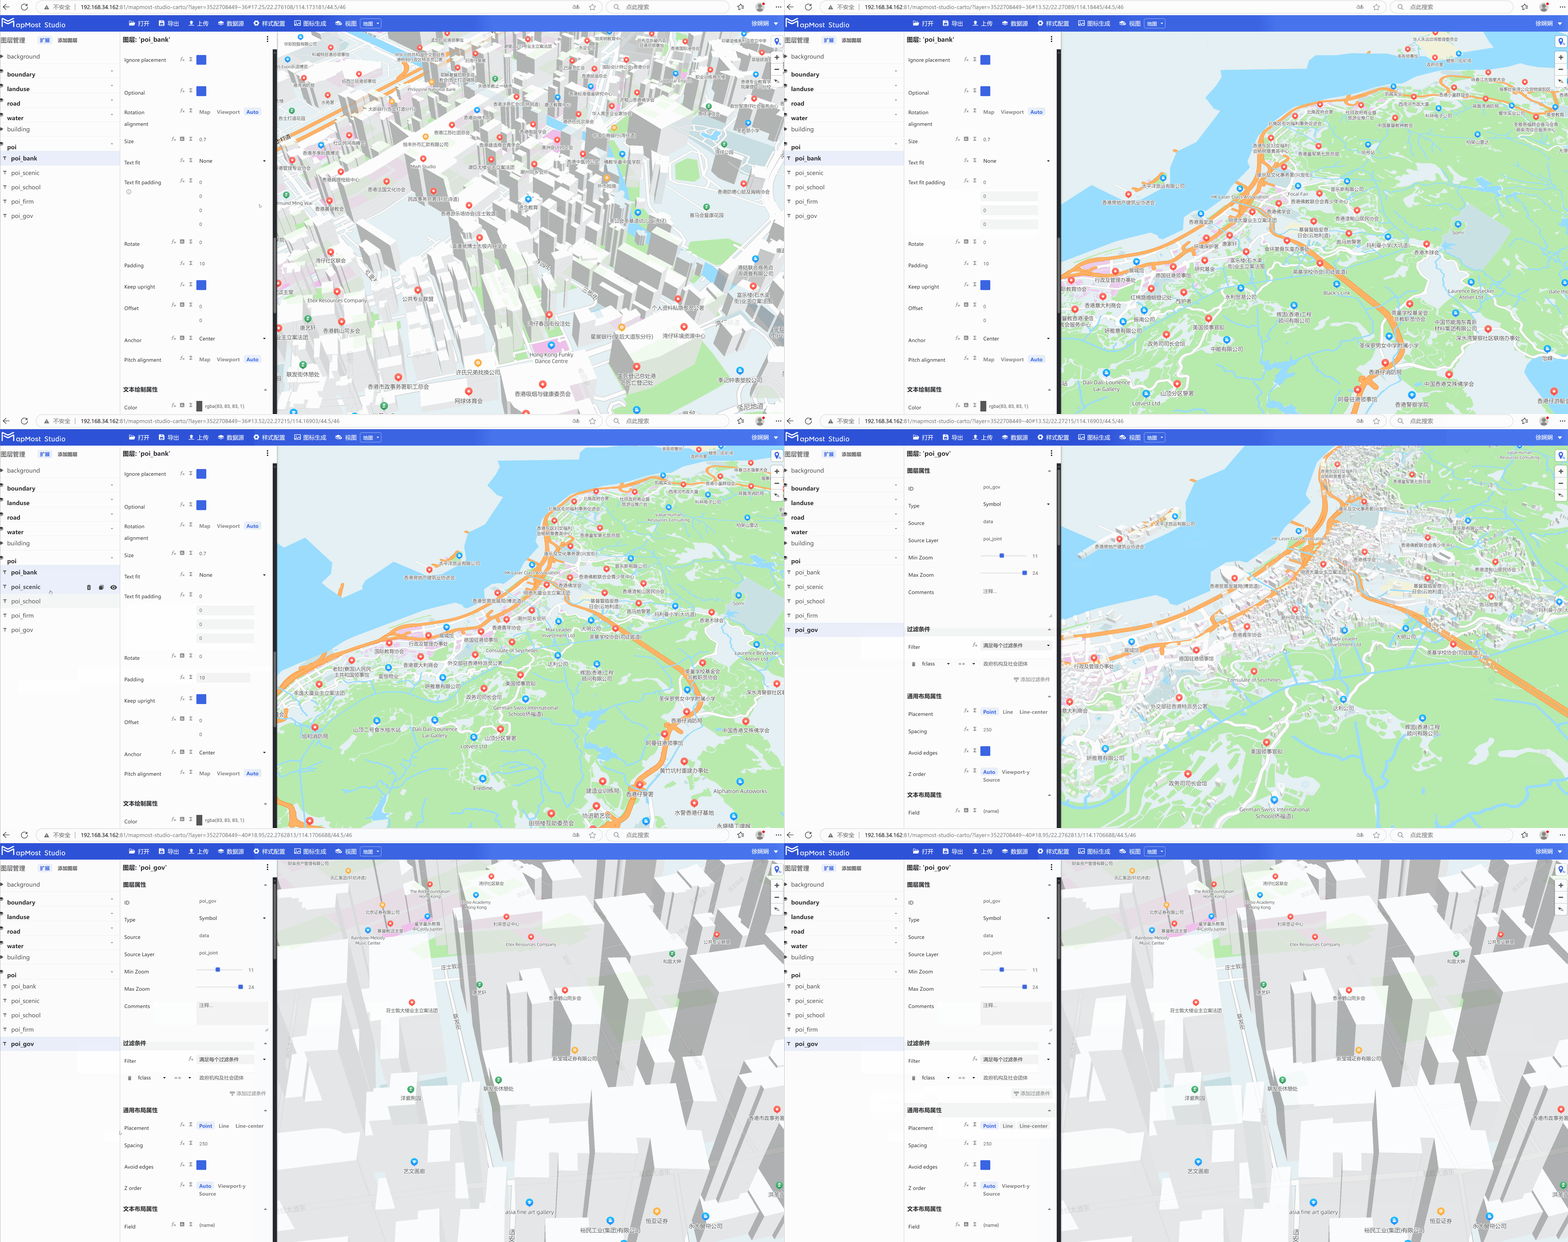
5.8. Adjust layer order
- According to the visual effects and illustration requirements, the overall layer order is adjusted to prevent text from being overlaid and data being avoided;
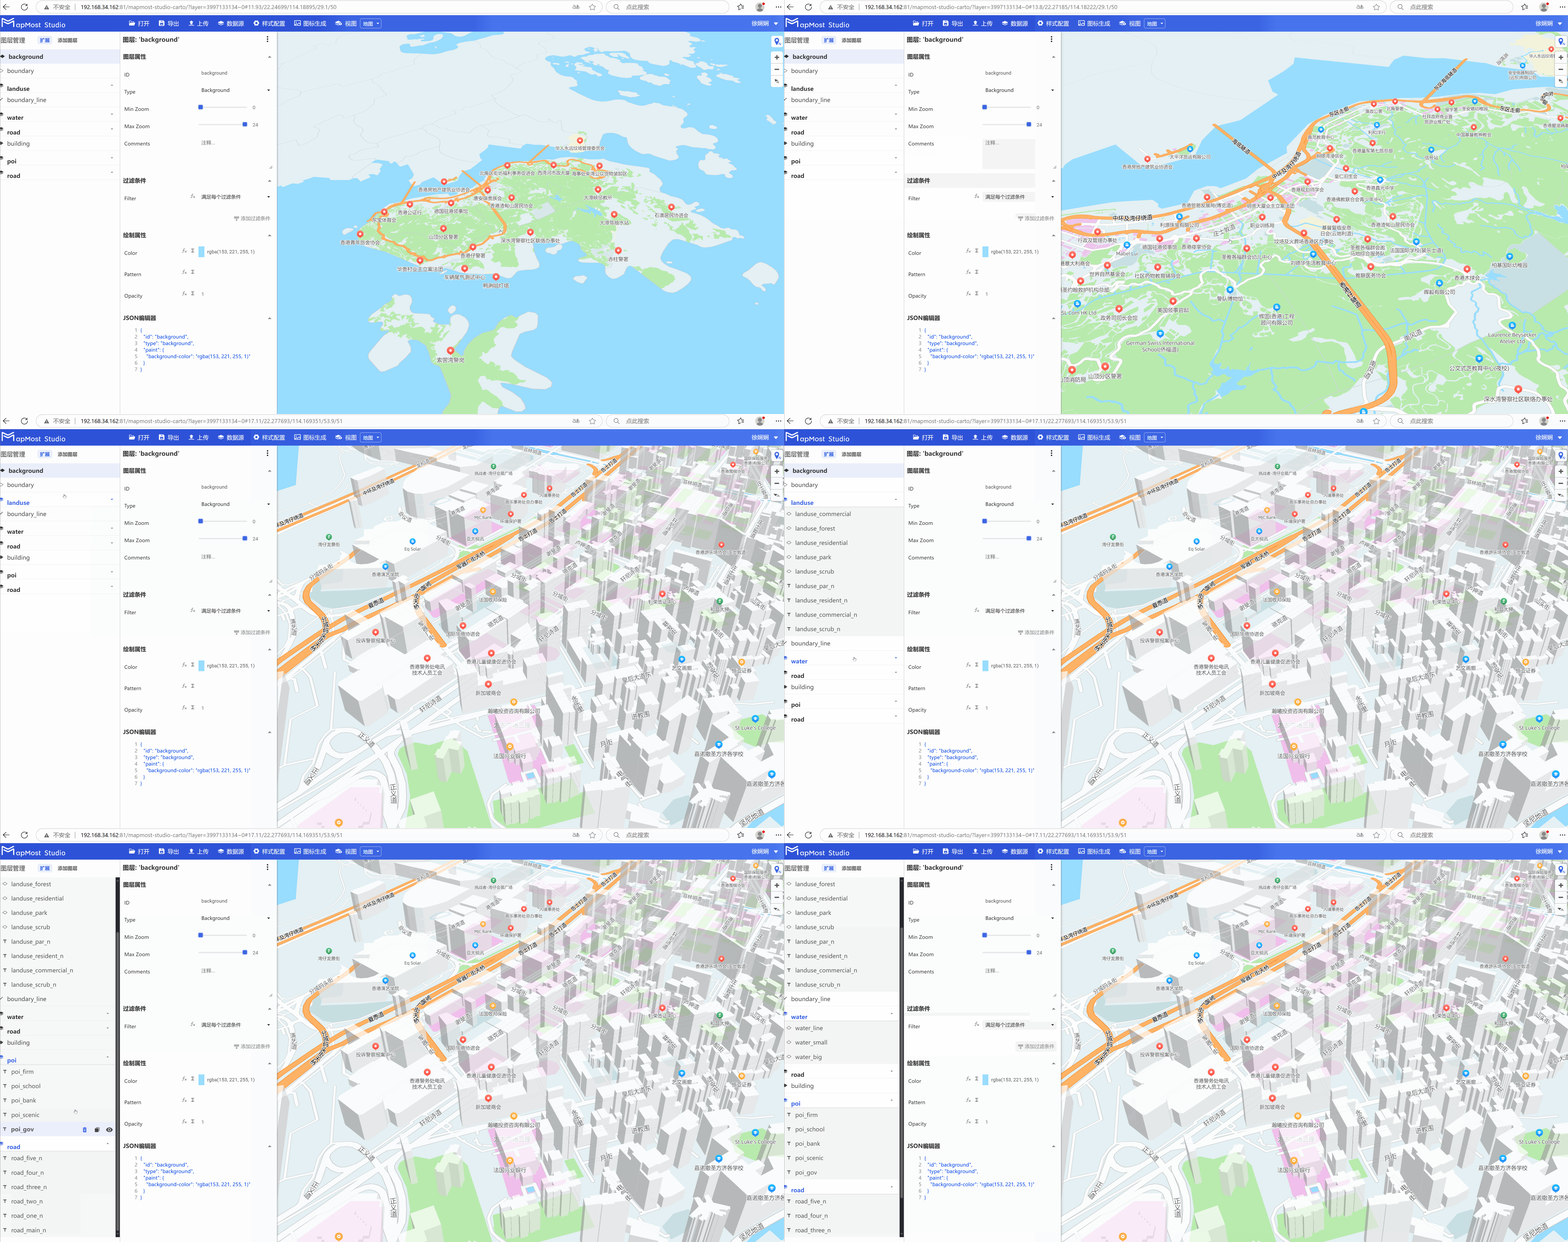
5.9. Style export
- Click the export button to export the map style;
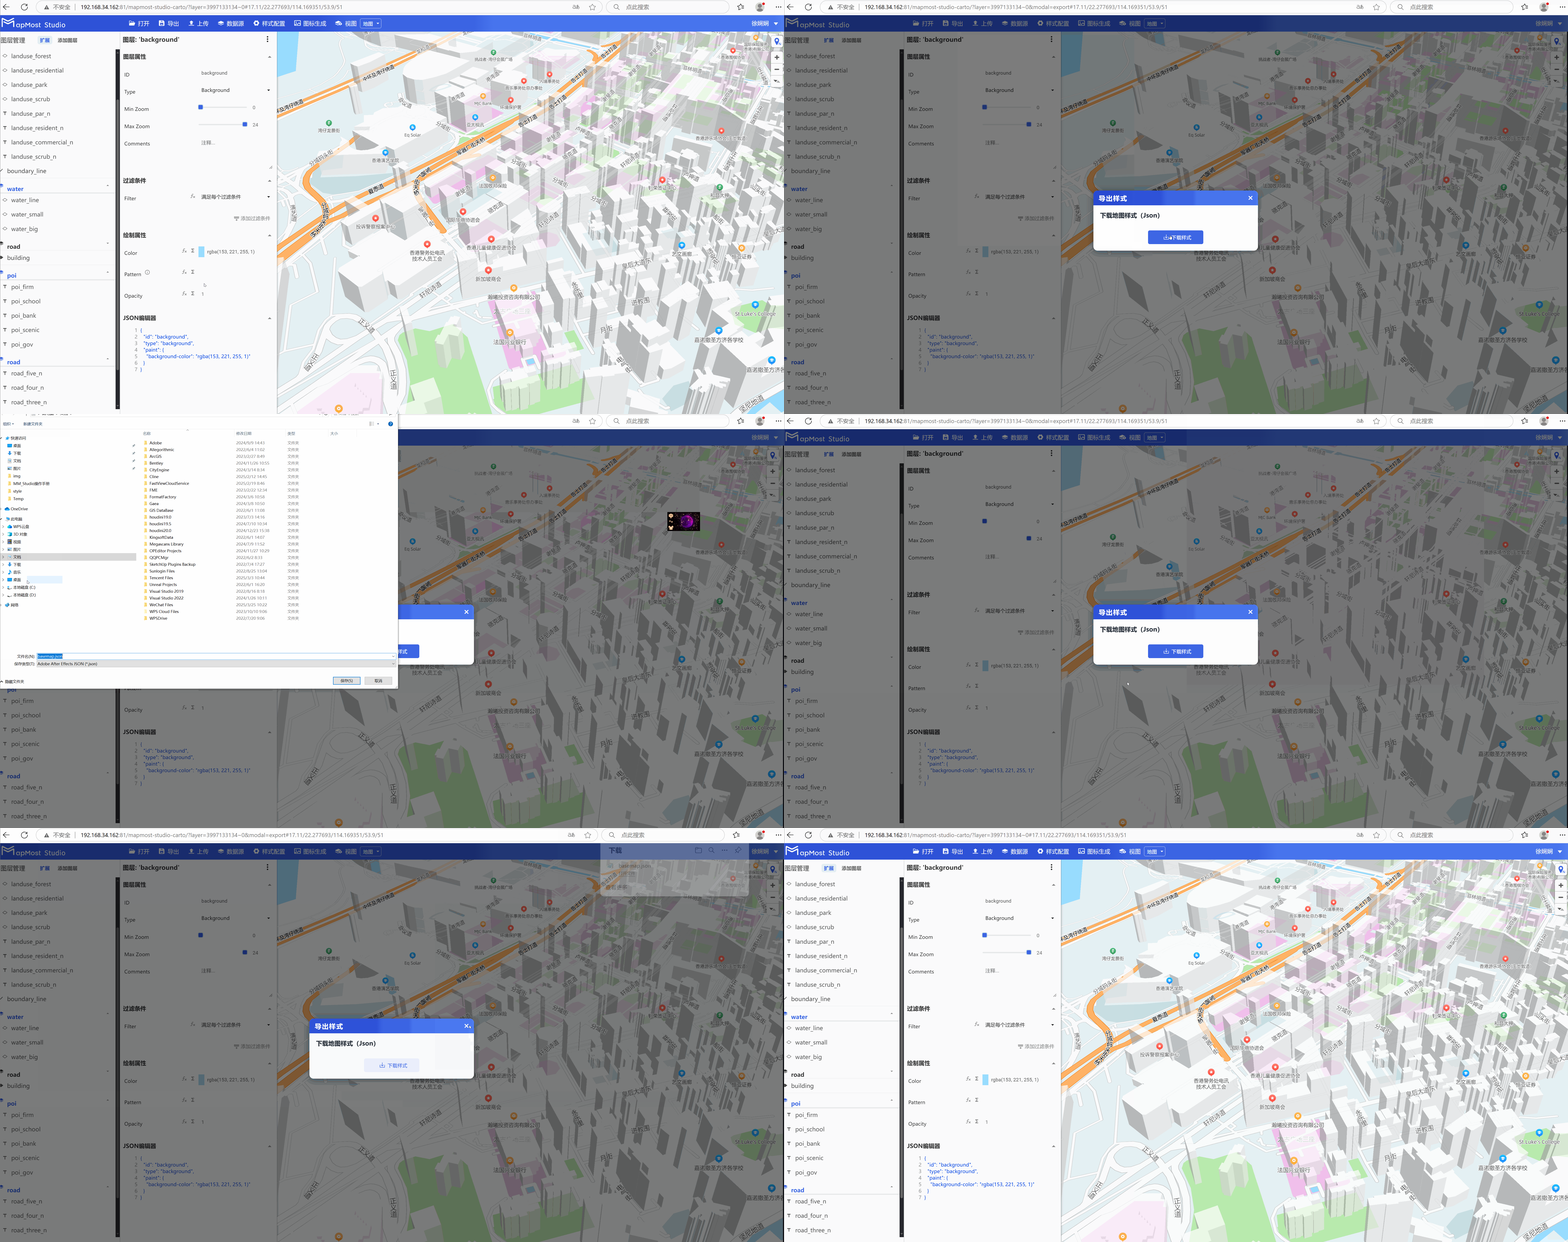
6. Mapmost SDK loading styles
- Mapmost SDK documentation link, Click to jump to Mapmost SDK online examples;
6.1. Mapmost SDK loading example
- Mapmost SDK loading effect and code display;
        #map {
            position: absolute;
            top: 0;
            bottom: 0;
            width: 100%;
        }
    </style>
    <script src="https://delivery.mapmost.com/cdn/sdk/webgl/v9.4.1/mapmost-webgl-min.js"></script>
</head>
<body>
<div id="map"></div>
<script>
    let map = new mapmost.Map({
        container: 'map',
        center: [114.13358978380347, 22.283166218948566],
        zoom: 14,
        style: "https://studio.mapmost.com:443/mms-style/1743052815295-15189827268-customStyle.json",//change to a custom map
        userId: '***' // authorization code
    });
</script>
</body>
</html>