menu bar

1. Open drawing file
 Open a local drawing file or open a drawing file in the Style resource set. There are two ways: upload the style and enter the style URL;
- Upload style: suitable for drawings that have been mapped in Studio and exporting the drawing results to the local;
- Enter the style URL: applicable to images that have been added to the Studio and the drawing results have been uploaded to the Style resource set; or if no images have been added, but there are templates in the Style resource set;
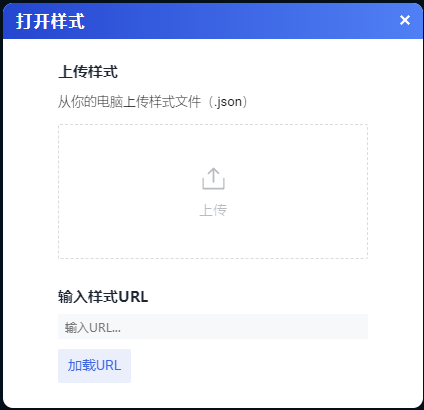
1.1. Upload style
- Click the Open button to display the Open Style dialog box, and click Upload;
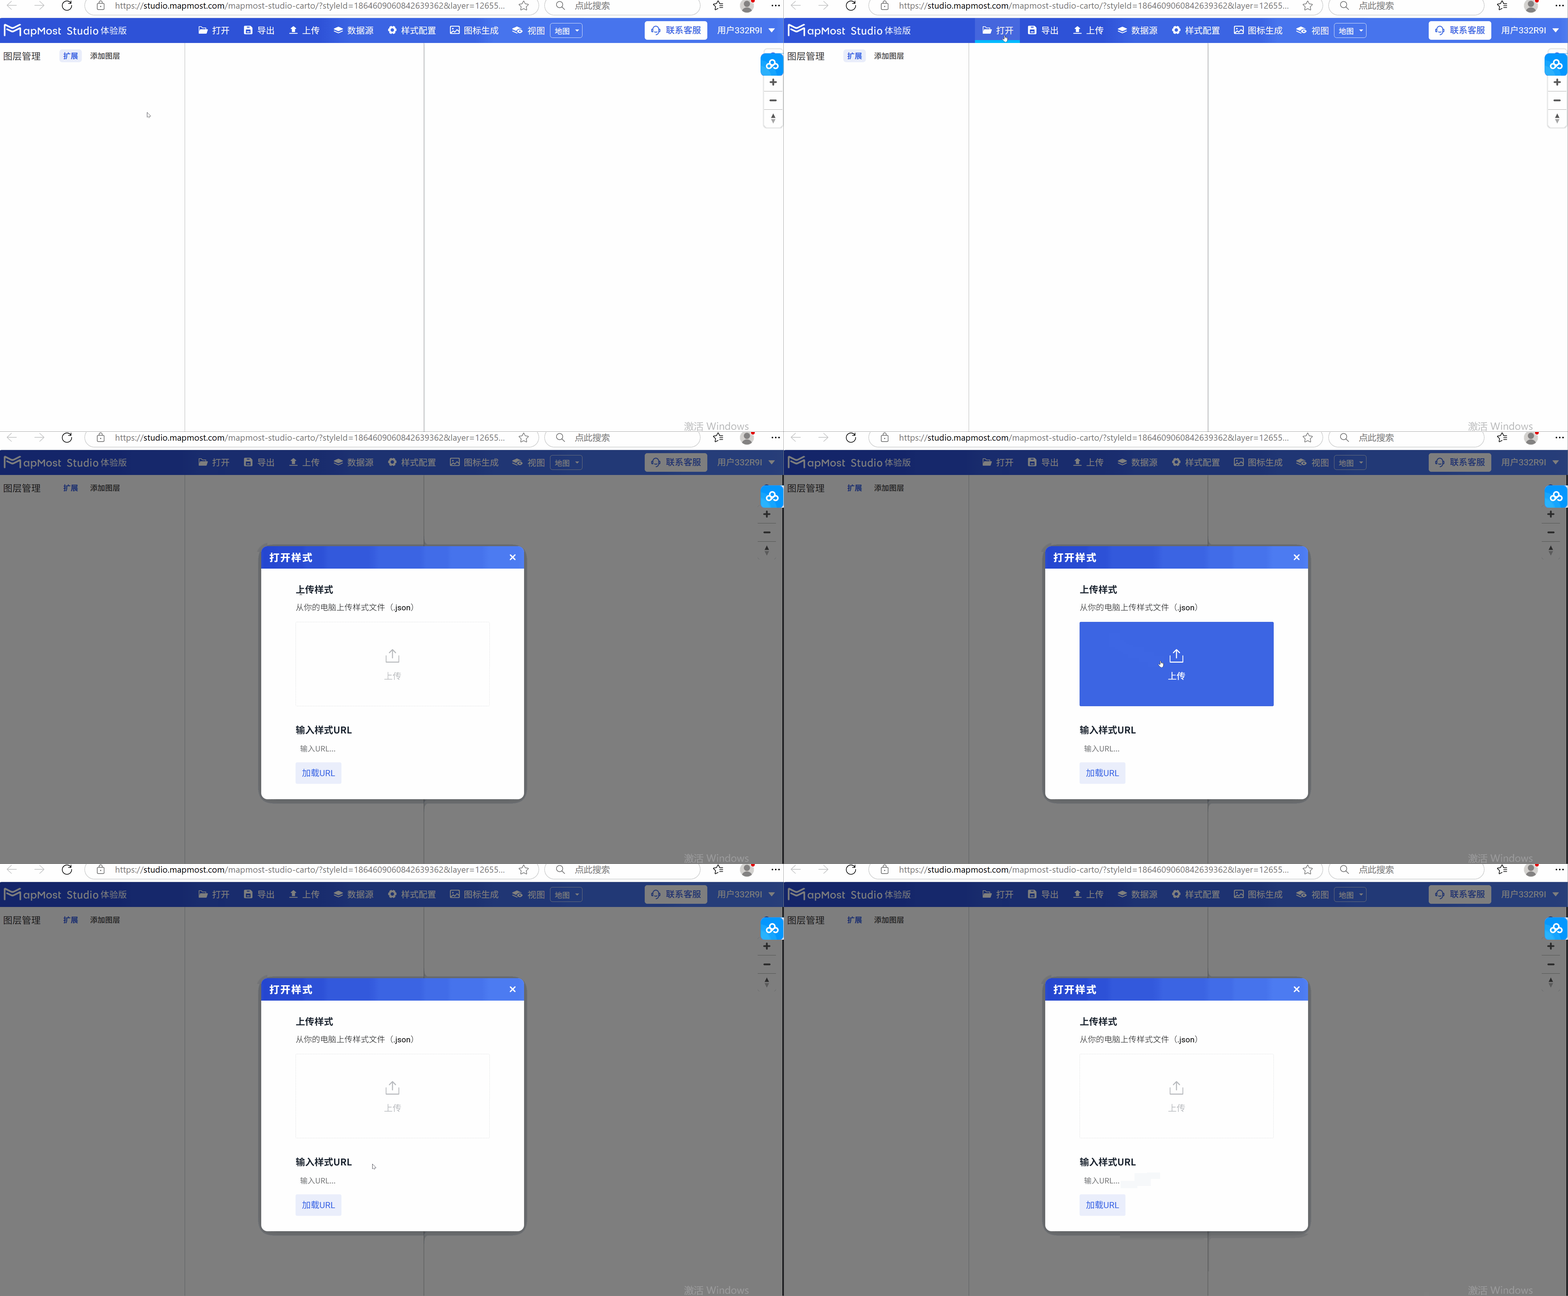
- An open dialog box will pop up to open a local image file. Currently, only json format files are supported. Load the locally saved mapping results here and click to open;
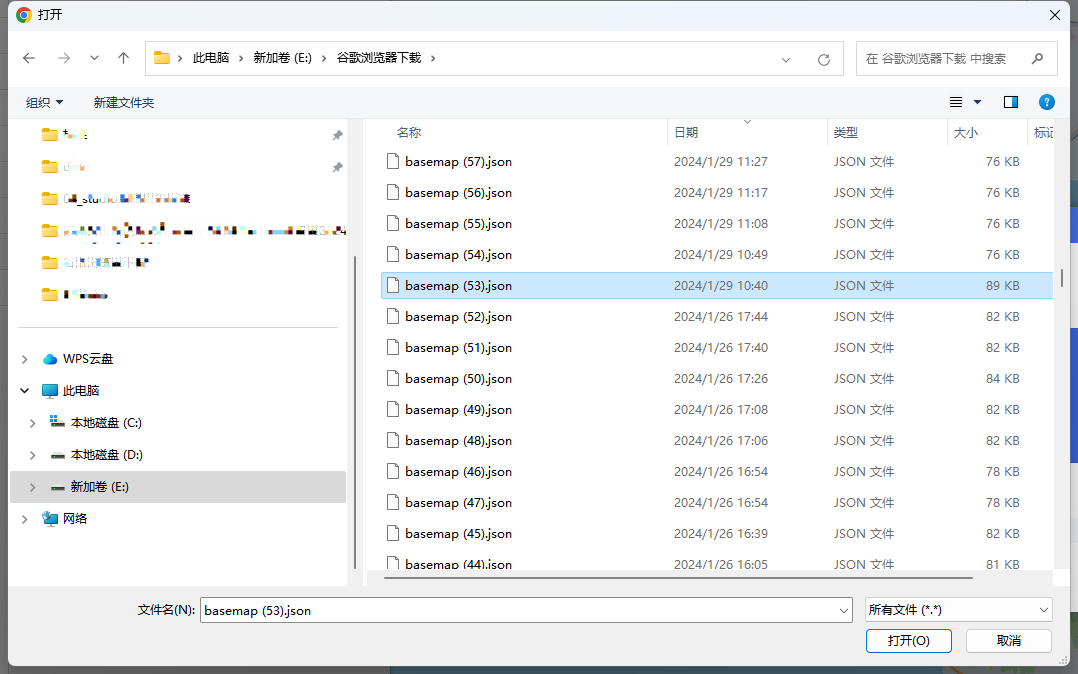
- The mapping interface loads and displays map layers, styles, etc.;
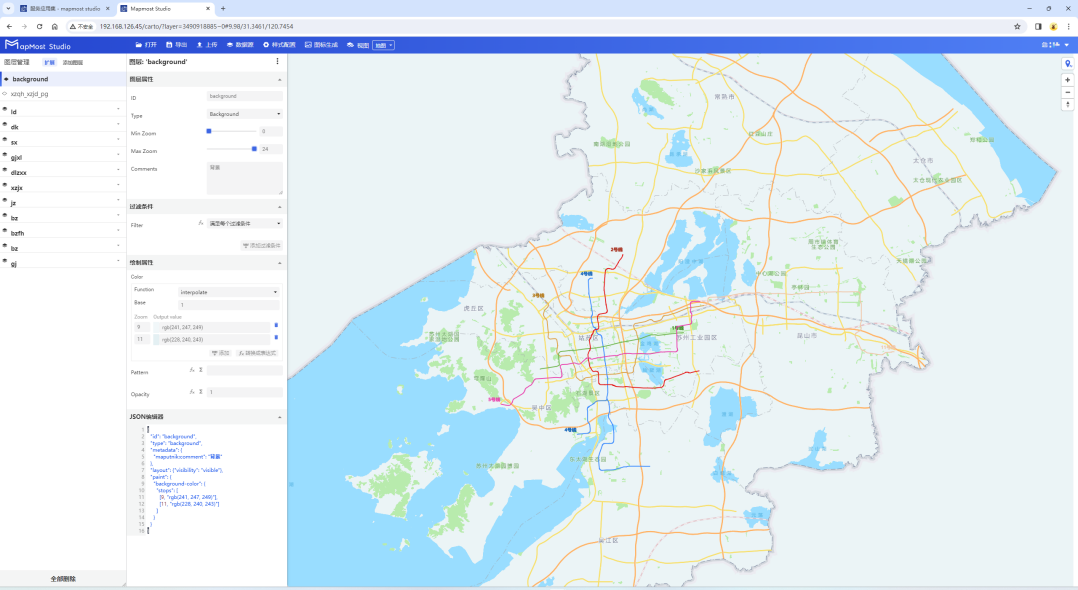
1.2. Load URL
- Click the Open button to display the Open Style dialog box. Return to the main interface of Mapmost Studio and click My Map. You can see that there are map templates and personal map results in the system. Copy the link, paste it, and open it in the mapping module. Detailed operations can be viewed at Click to jump.
2. Export mapping results
 exports the mapping file in json format, which can be understood as saving the mapping result file locally.
2.1. Export drawing files
- Click the export button to export the drawing style file;
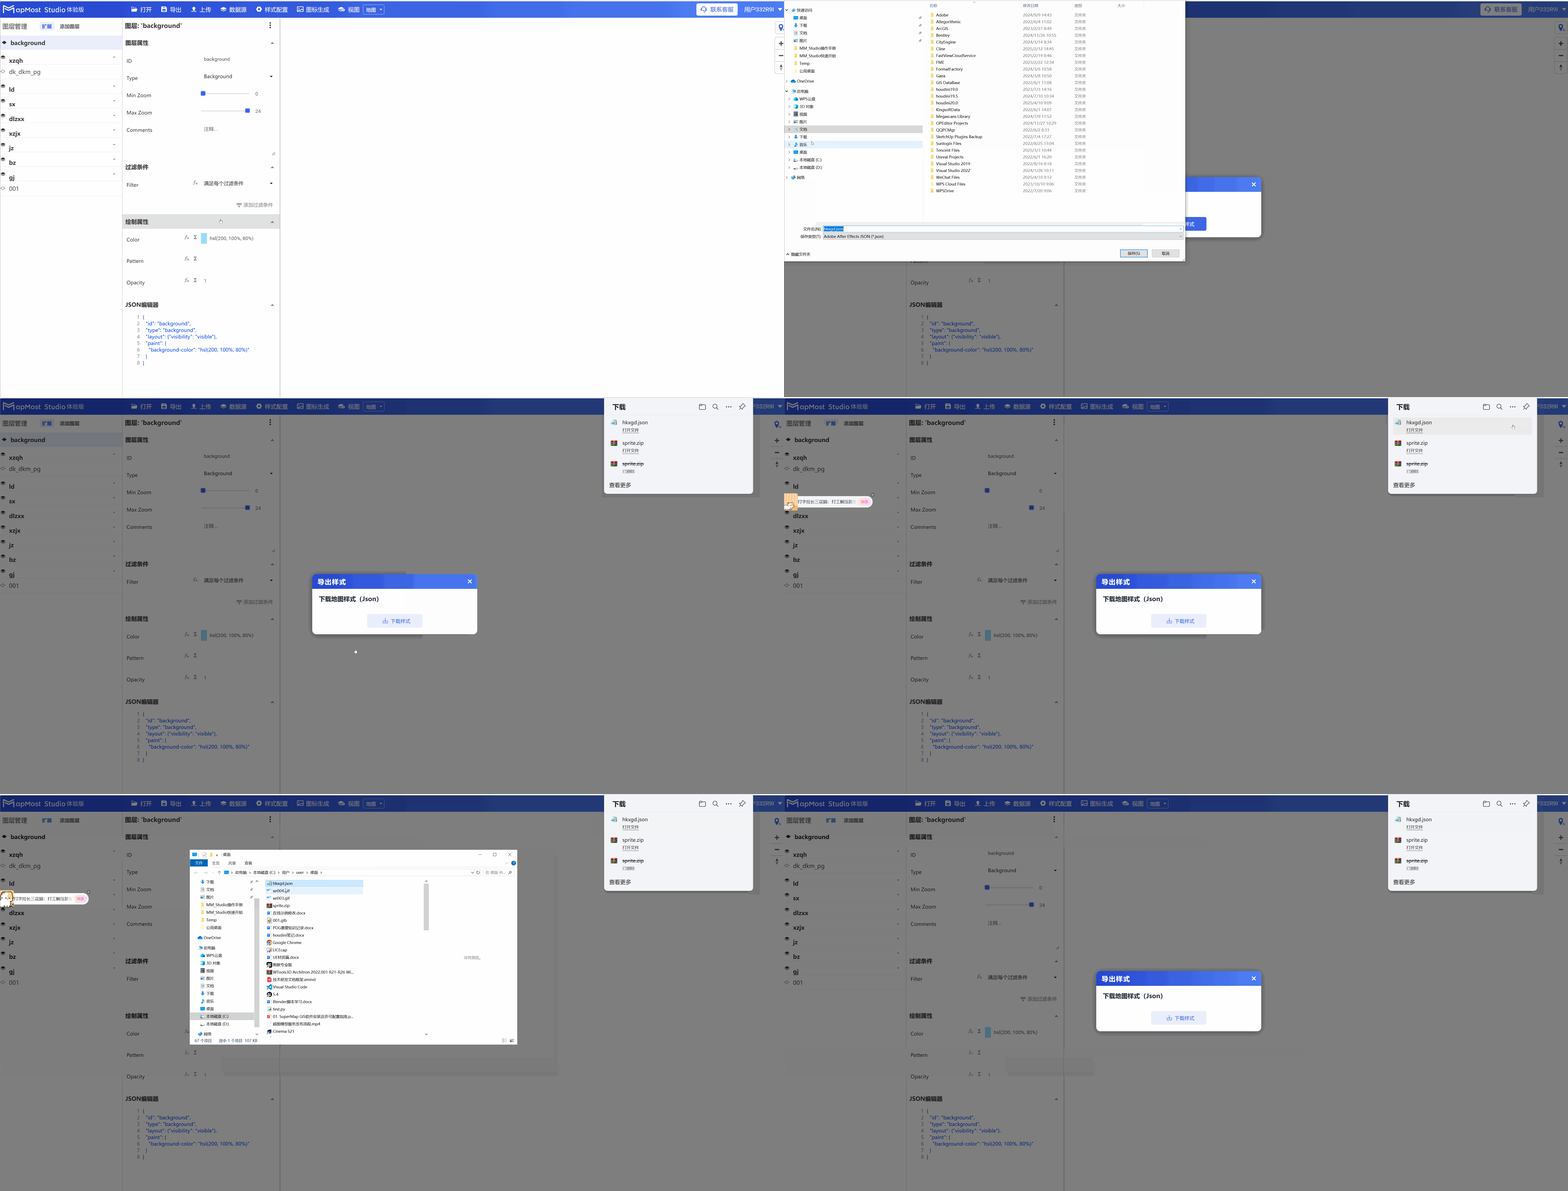
3. Upload the drawing results to the Style resource set
Upload Style resources;
3.1. Upload to Style resource set
Click the upload button
 , open the pop-up window, enter a custom name in the map style name, and click OK;
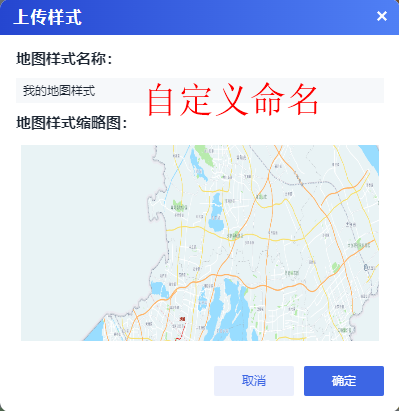
A map style upload success window will pop up, click to jump to my map;
Jump to Mapmost Studio-My Map page, and you can see that the latest map style just released is already in my map results;
4. data source
 data source is used to load published vector map services. Only when these services are loaded can the layers under the services be called in the cartography module. For details, please refer to "Charting prerequisite: "Data Source" module explained;
5. Style configuration
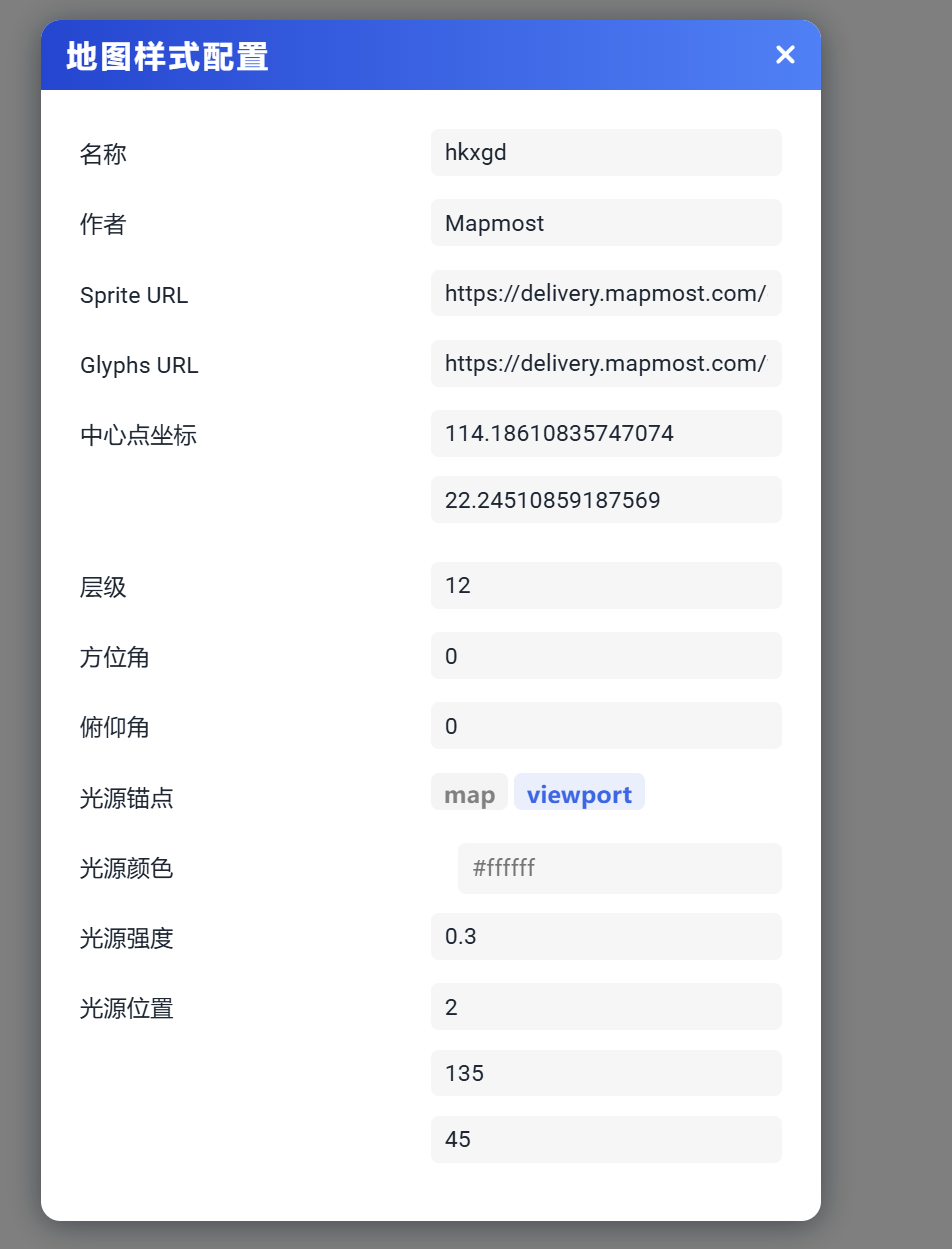
 style configuration is used to name the name of the map, author, Sprite URL (symbolic link), Glyphs URL (font link), set map center point coordinates (X, Y), map initial interface display level (0-24), azimuth angle, overhead angle, light source anchor point, light source color, light source intensity, light source position;
5.1. Display the "Map Style Configuration" pop-up window
- Click the style configuration button to open the map style configuration dialog box;
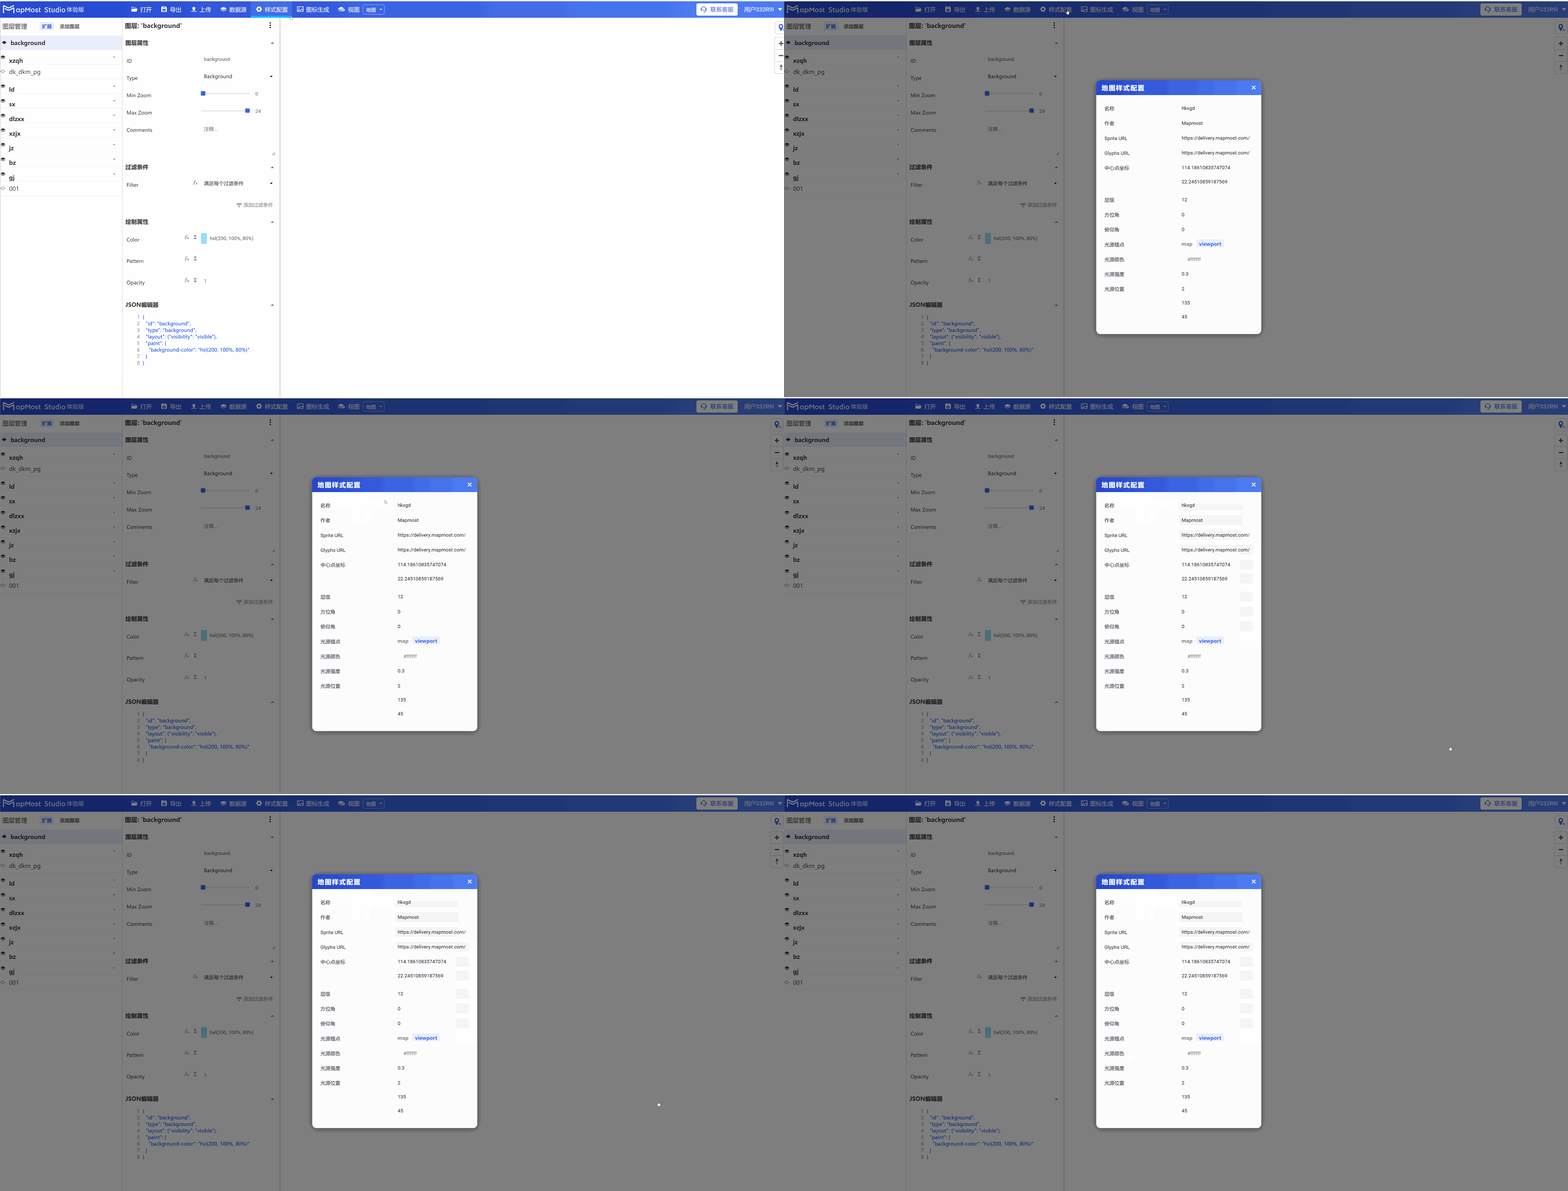
5.2. Configure pop-up window parameters
- Custom map name and author;
- Sprite URL (symbolic link) loading: Load the sprite image link uploaded to the server;
- Glyphs URL (font link) loading: loads the font link uploaded to the server;
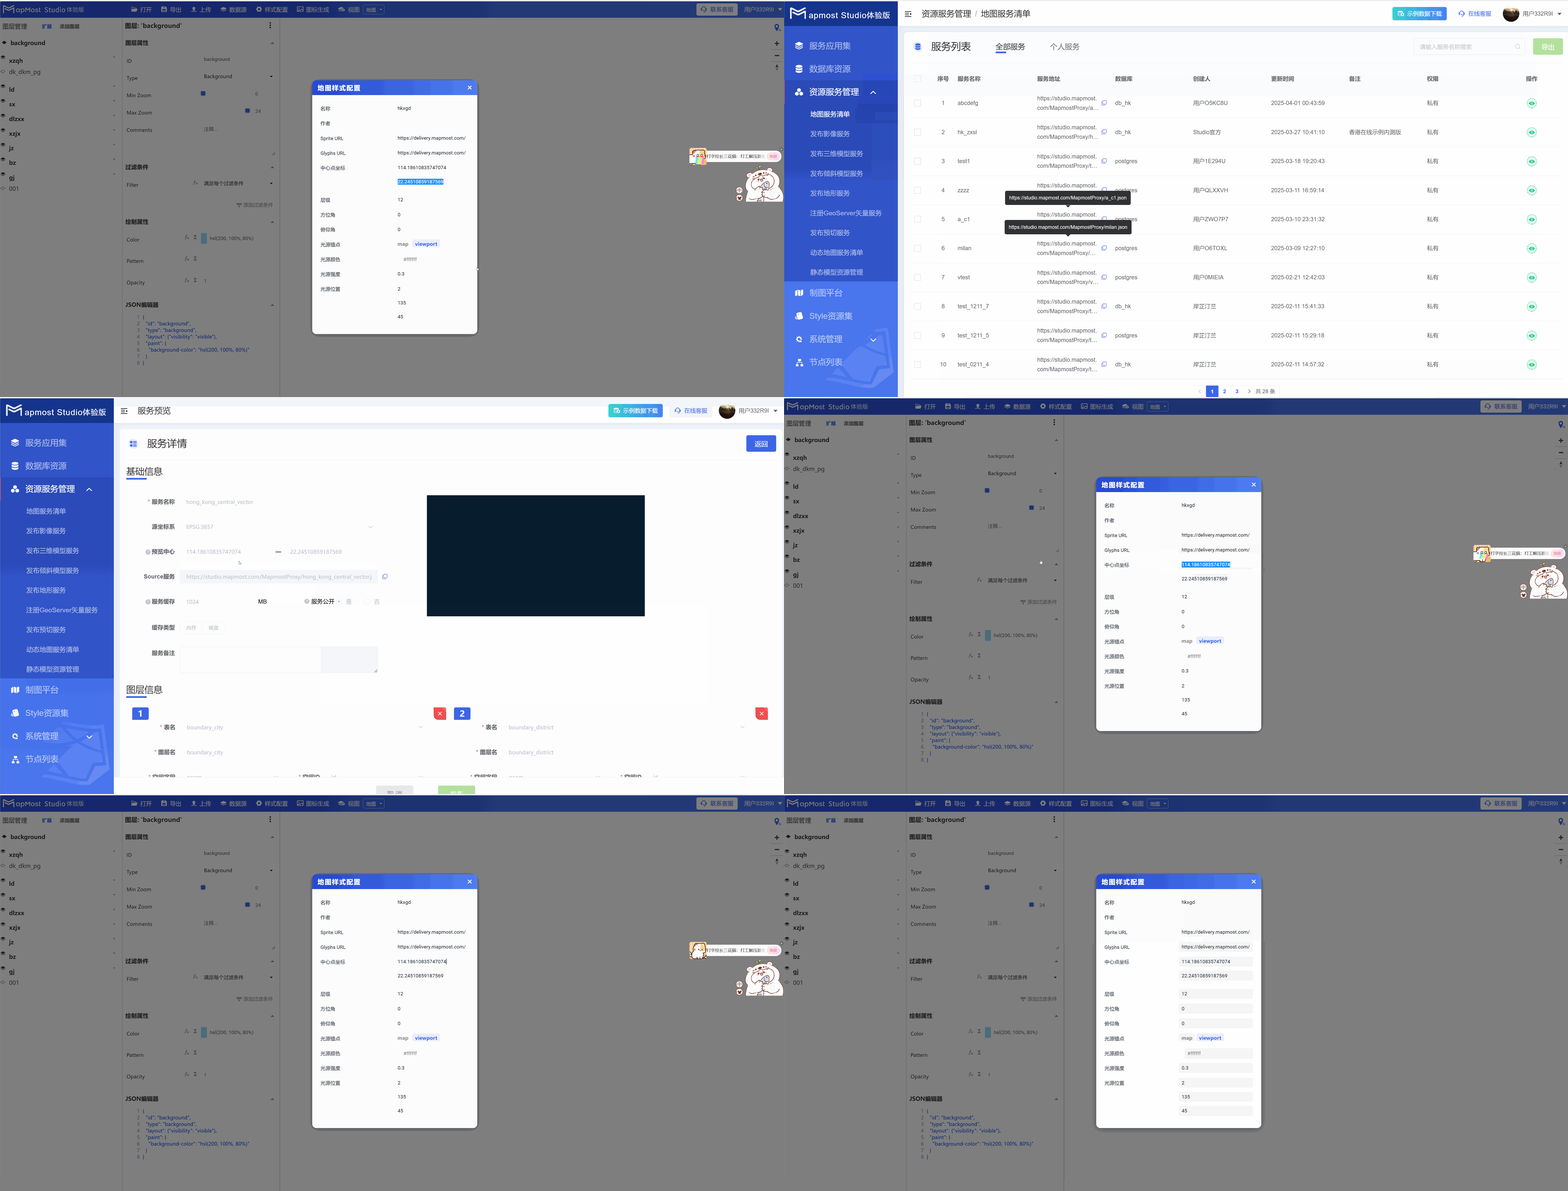
- Set the center point coordinates (X, Y) of the map initial interface. See Figure 2 for the acquisition method:
- Set the display level of the map initial interface (0-24);
- Set azimuth: Set the azimuth of the map initial interface;
- Set the overlooking angle: Set the overlooking angle of the initial interface of the map;
- Set the light source anchor point;
- Set the light source color;
- Set the light source intensity;
- Set the light source position;
6. Icon generation
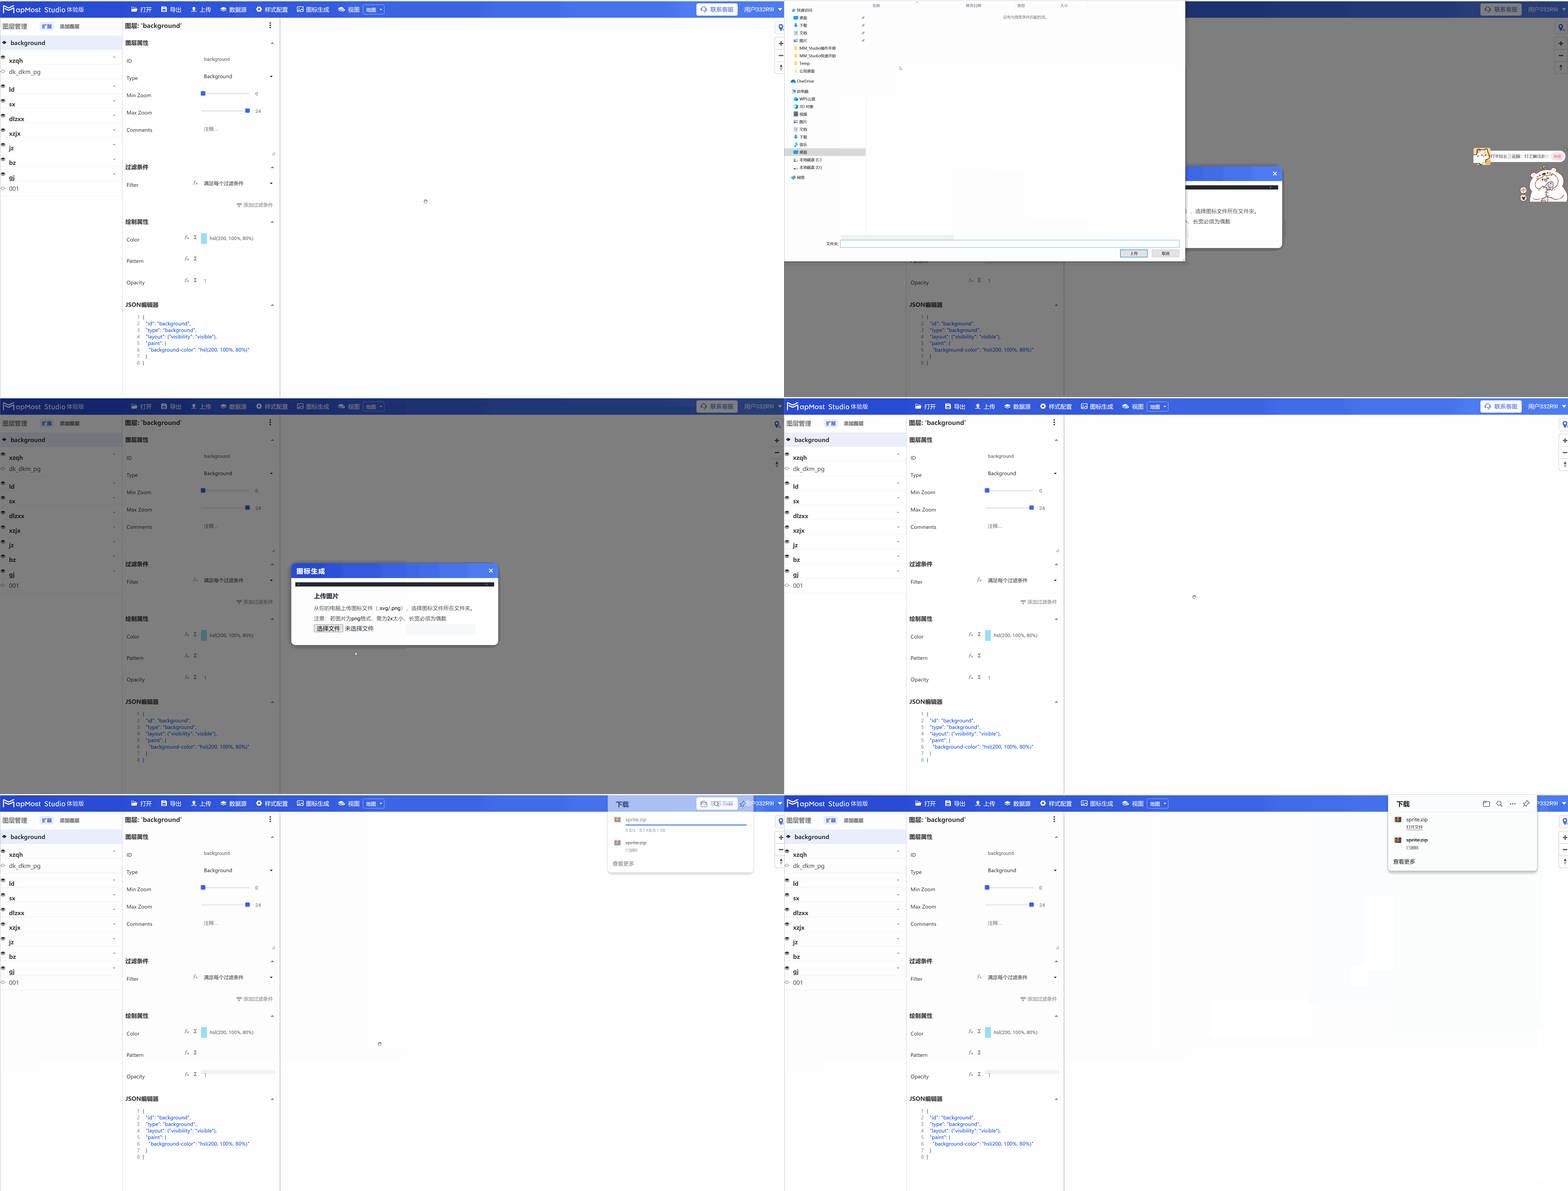
Icon generation is mainly used to upload point symbols required for drawing to the Studio platform. You need to prepare symbols in.svg or.png format locally. After generating sprites through the icon generation tool of the cartography module, upload them to the server. After generating the URL, configure the style, load the URL and use it in the cartography module.
6.1. Upload.svg/.png images and generate sprite.zip compressed files
- Click the icon to generate, select the file and upload icon;
7. View (view/map)
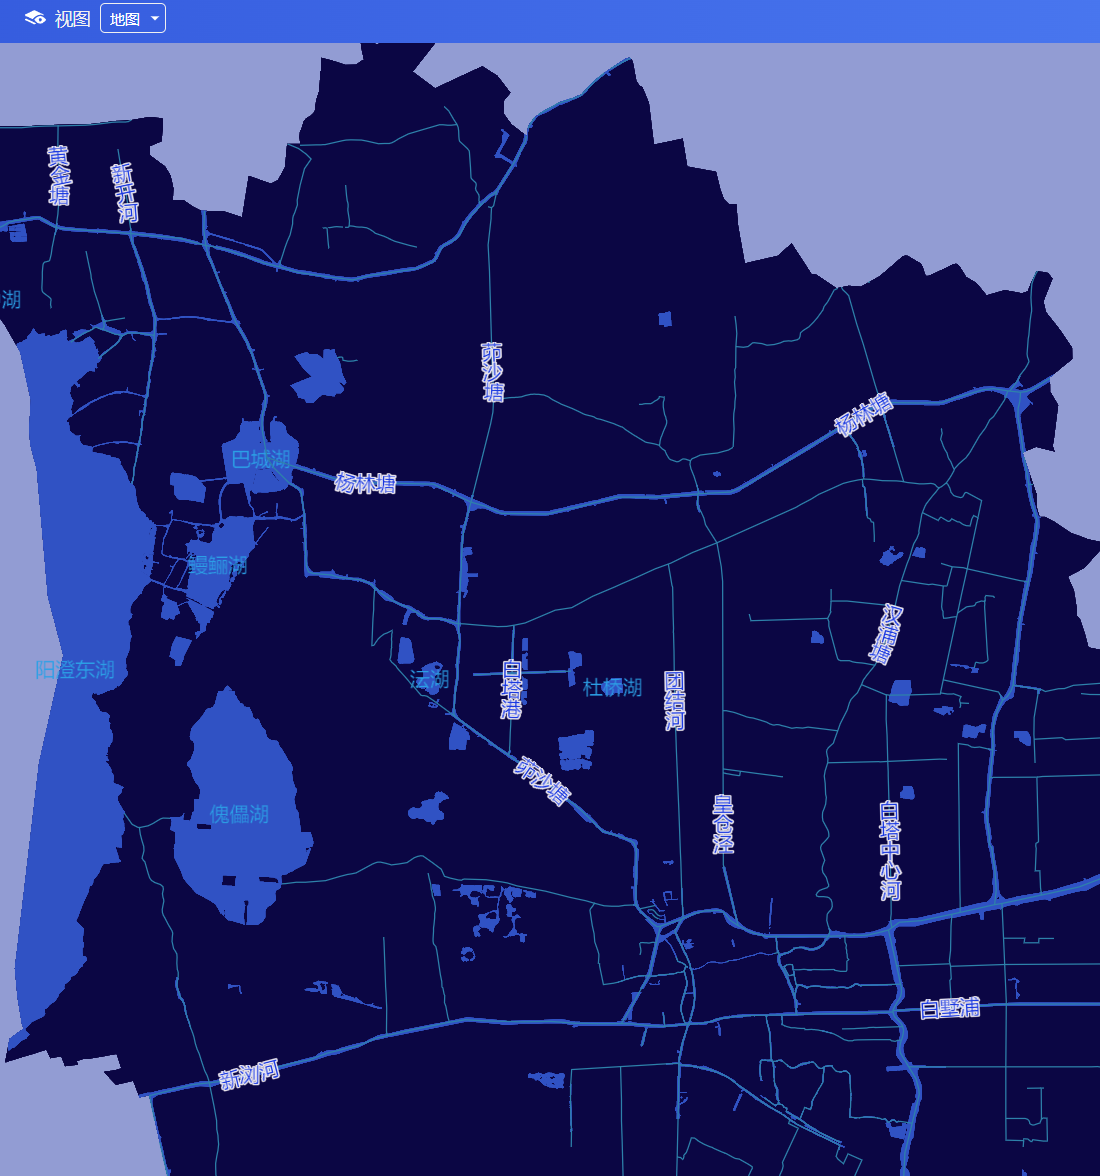
7.1. View (map)
Select , and the page will display the drawing effect.
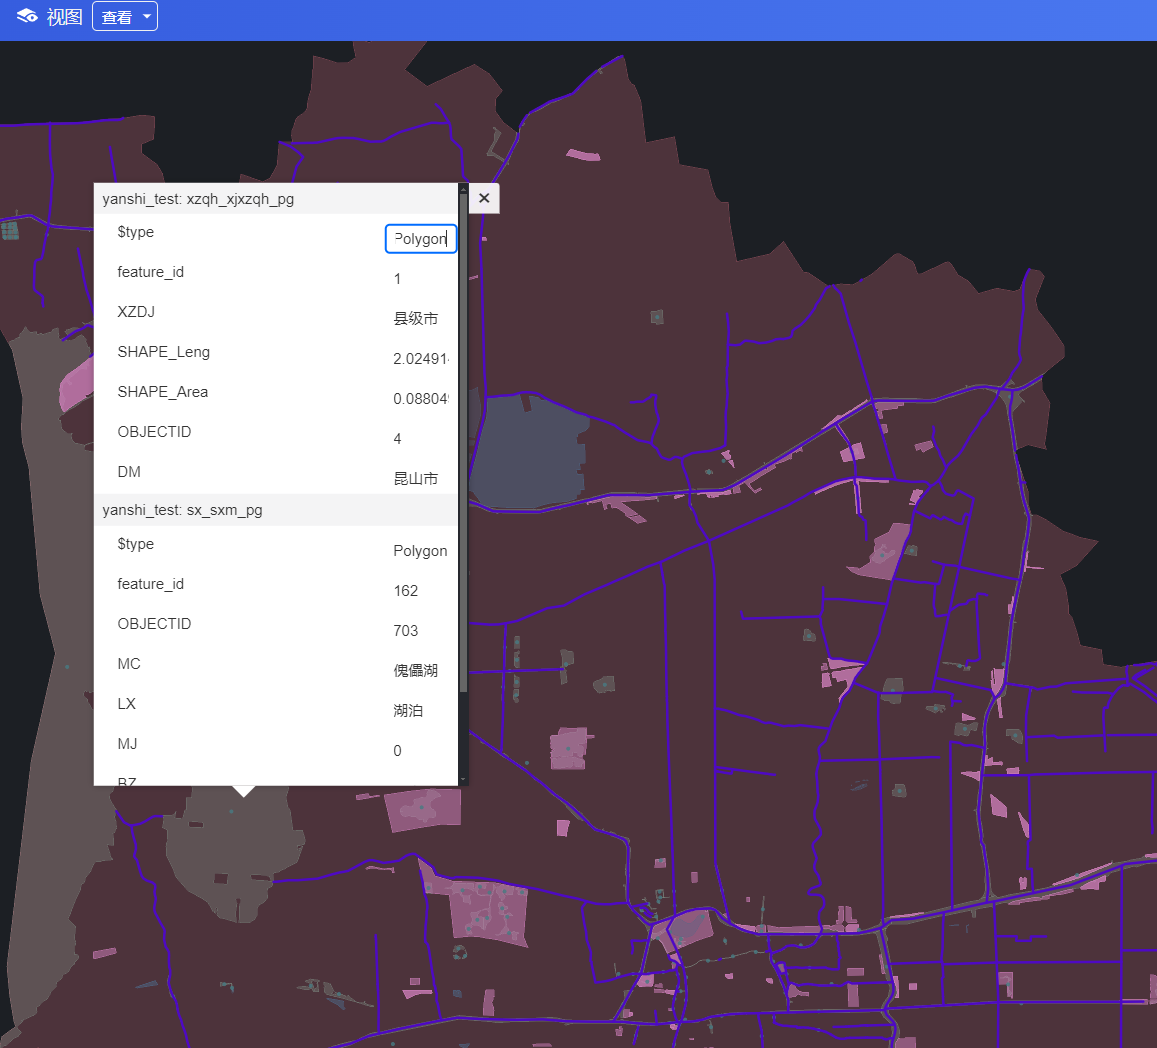
7.2. View (View)
Select , move the mouse somewhere, and you can view the attribute information of all the features there;